
Looker Studio vs Power BI: Reporting Costs, Sharing and the Migration Test
Choose Data Studio, formerly Looker Studio, when a small group maintains Google-focused marketing reports for many readers. Choose Power BI when the team needs a reusable semantic model, deeper calculations and a Microsoft reporting workflow it can maintain. Price the actual viewers, data connections and operating work, then test the same report and restricted-reader access before committing.
On this page
At Martechdevs, we earn implementation fees for connecting data, building reporting models and handing over working reports. The comparison below helps you decide which reporting setup merits that work.
Which tool should a marketing team choose first?
Start with Data Studio for straightforward Google-source reporting and low-cost distribution; start with Power BI when shared modeling and analysis are the main requirement. Existing skills and licences can change that starting point.
If neither route fits, compare open-source and commercial options beyond Metabase against the same reporting requirement.
Google provides Data Studio connectors for Google Analytics, Google Ads, Search Console, Sheets and BigQuery, among other sources. Power BI supports semantic models with relationships and explicit measures written in Data Analysis Expressions (DAX). These are useful starting capabilities, not proof that either product has already modeled your customer journey correctly. Google connector list, Power BI modeling guidance.
For a growth team that needs acquisition, spend and qualified pipeline, write the output before choosing the front end. Define the customer or account unit, the reporting dates, the attribution rule and who may see each client's records. Our warehouse and reporting implementation scopes those dependencies alongside the report.
The default recommendation is to keep the simpler route if it answers the real question and passes access and maintenance tests. A tool change earns its cost when it removes a demonstrated limitation. Use other Data Studio alternatives if neither candidate fits the required workflow.
What are the practical pros and cons of each tool?
Data Studio's appeal is inexpensive report distribution; Power BI's is the modeling environment around the report. Evaluate the tradeoffs through the actual people who will build, maintain and consume the output.
Data Studio
- Best for: Google-source marketing reports maintained by a small author group and shared with many readers.
- Pros: Google-source connectors; no general creator or report-viewer licence fee; optional Pro organization ownership and team management.
- Cons: Complex joins require careful grain control; blends stay within their report; connectors, queries and maintenance remain separate work.
- Free tier and startup offer: General no-cost reporting is available. This comparison assumes no startup-specific concession or cloud credit covering a Pro subscription.
- Choose it if: The report, access model and source-refresh behavior work with a maintainable data layer.
- Skip it if: The team needs reusable analytical models that its proposed Data Studio architecture cannot supply reliably.
Google documents the free product and Pro price, Pro ownership and report-local blend behavior.
Power BI
- Best for: Teams maintaining shared analytical models and measures, especially with existing Microsoft reporting skills and eligible licences.
- Pros: Power Query data preparation; explicit DAX measures and model relationships; Pro entitlement included in eligible Microsoft 365 E5 and Office 365 E5 subscriptions.
- Cons: Ordinary shared reports require reader licensing; Premium Per User content has its own access rule; model and measure maintenance need an accountable owner.
- Free tier and startup offer: Free personal analysis is available. Budget the supported sharing route after trials or any confirmed temporary offer expire.
- Choose it if: The model, ordinary-reader experience and complete licence or capacity cost pass the pilot.
- Skip it if: A simple report is the whole requirement and additional modeling or distribution costs have no demonstrated benefit.
These distinctions follow Microsoft's modeling guidance, pricing and licence definitions.
Is Data Studio the same product as Looker Studio?
Data Studio is the current name of the product previously called Looker Studio. Google's April 2026 release notes record the rename and updated home page. Looker remains a separate product; a comparison involving LookML and Looker platform pricing answers a different buying question. Data Studio release notes.
Use the current name in the implementation inventory while retaining old names where they help identify an existing report or contract. Our Data Studio pricing guide covers the rename, free edition and Pro subscription in more detail.
Who needs a paid licence to build or read a report?
Count people by their actual work and the location of the content. A free account, a paid author and a paid capacity confer different rights.
If Tableau is also on the shortlist, compare Tableau's per-user prices using the same author and viewer requirements.
USD public list rates before tax. Power BI rates are per user per month, paid yearly. Google's Pro project rate is USD 9 per user per project per month; Google says subscription length can affect pricing. Confirm the selected commercial terms before purchase.
| Configuration | Author or maintainer | Ordinary report reader | Public licence basis |
|---|---|---|---|
| Data Studio no-cost | No licence charge | No licence charge | USD 0 software licence |
| Data Studio Pro self-service | Pro for creating, editing or managing Pro content | Report-only viewing needs sharing permission, without a Pro licence for that activity | USD 9 per user/project/month |
| Power BI Free | Personal analysis | Shared consumption needs a supported route | Free personal account |
| Power BI Pro, shared capacity | Pro | Pro for ordinary shared Pro content | USD 14 per user/month, paid yearly |
| Power BI Premium Per User | PPU for PPU content | PPU for access to a PPU workspace | USD 24 per user/month, paid yearly |
Sources: Google pricing, Google's self-service subscription rules, Microsoft pricing and Microsoft's licence types.
Power BI also supports free-user consumption when the content is in eligible Premium capacity or Fabric F64 or larger capacity. That capacity is a separate purchase. A PPU workspace is a different arrangement and generally requires PPU users. Confirm the workspace assignment and test the intended reader, rather than inferring access from the word “Premium.” Power BI sharing entitlements.
Google's organization-wide monthly-active-user agreements also differ from self-service Pro. The estimates here use self-service subscriptions, one project and only the required maintainer assignments. Purchased unused licences can still be billed. Data Studio subscription models.
Keep privacy separate from the seat calculation. Power BI's Publish to web makes a report accessible without authentication and can expose underlying data. Use it for deliberately public information, not a private client-reporting workaround. Microsoft's publishing guidance.
What do 10-person and 25-person teams pay?
On the stated licence assumptions, a 10-person team pays USD 1,680 a year for Pro for everyone, versus USD 324 for three Data Studio Pro maintainers in one project. A 25-person team pays USD 4,200 versus USD 756 for seven maintainers.
These hypothetical teams match the cross-tool BI pricing comparison: ten people comprise one builder, two editors and seven readers; 25 comprise two builders, five editors and 18 readers. Assume constant headcount, no existing Power BI entitlement, no paid capacity, no startup discount and unchanged list rates. Data Studio readers are not assigned paid Pro licences.
USD software licence costs only. Two-year figures assume the same configuration and rates throughout; they are planning totals, not price guarantees. Connector, warehouse, support, implementation and staff costs are excluded.
| Configuration | 10 people: one year | 10 people: two years | 25 people: one year | 25 people: two years |
|---|---|---|---|---|
| Data Studio no-cost | 0 | 0 | 0 | 0 |
| Data Studio Pro, maintainers only | 324 | 648 | 756 | 1,512 |
| Power BI Pro, every shared user | 1,680 | 3,360 | 4,200 | 8,400 |
The 25-person Pro calculations are 7 × USD 9 × 12 = USD 756 and 25 × USD 14 × 12 = USD 4,200. The USD 3,444 annual licence difference is one part of the choice. It does not establish which implementation needs less modeling, connector work or review.
Before buying Power BI Pro, check assigned entitlements. Microsoft lists Pro as included in Microsoft 365 E5 and Office 365 E5. If eight of the ten shared users already have that entitlement, only two additional Pro licences are needed for this particular Pro-sharing scenario: 2 × 14 × 12 = USD 336. The existing Microsoft subscription remains a business cost. Microsoft's included entitlement.
Use a cost worksheet with separate lines for licence assignments, source accounts, refresh/query workload, support, initial rebuild and continuing administration. Keep internal staff capacity separate from cash bills. For warehouse-backed reports, estimate BigQuery query costs or the relevant warehouse workload from the actual report.
Year two removes only genuinely one-time work. Connector renewals, capacity, source changes, metric maintenance and licence commitments continue. Price the post-trial setup, and enter a startup benefit only when the approved offer covers the exact service and period.
How do connectors and modeling change the decision?
The reporting tool needs a reliable path from each required source to the metric. List the actual connector, supported objects, historical coverage, refresh behavior and owner instead of treating “connects to the CRM” as a complete specification.
Data Studio's Google-provided list includes GA4, Google Ads, Search Console, Sheets and BigQuery. Other sources can use third-party connectors or prepared data delivered through a supported database route. Identify who maintains each connector and what the quoted package includes. Available Data Studio connectors.
For a paid-media report, separate the source jobs:
| Source | Required data | Acceptance question |
|---|---|---|
| Google Ads and Meta Ads | Spend and stable campaign identifiers | Are all required accounts, currencies and completed dates present? |
| GA4 | The selected acquisition or conversion measure | Does the dimension scope match the question, and are quotas or incomplete periods visible? |
| CRM | Unique opportunities, qualification history and the chosen amount | Do contact joins preserve one opportunity and its attribution policy? |
| Billing | The selected invoice, payment or revenue measure | Does the report distinguish realized value from open pipeline? |
A partner connector can be the right small-team solution. A marketing data warehouse becomes useful when shared history, repeated joins and consistent definitions justify its operating cost. Compare Snowflake and BigQuery at that data-layer decision, rather than letting the preferred chart editor choose the whole stack.
Where does Data Studio blending need care?
Data Studio blends support up to five sources and belong to the report containing them. They inherit source freshness and credentials. Google also documents aggregation before joining, so selected dimensions can change what the blend actually combines. How Data Studio blends work.
A blend is useful when its keys and grain are deliberate. It becomes hard to maintain when separate reports copy slightly different revenue logic. Move repeatedly used transformations into an owned model or semantic layer when the duplication becomes a real problem.
What does Power BI modeling add?
Power BI provides a semantic-model layer for relationships and reusable measures. Power Query prepares data, while DAX measures calculate results under the model's filter context. Microsoft's guidance recommends consistent fact-table grain and suitable fact/dimension relationships. Power BI star-schema guidance.
Those capabilities still need a model owner. Connecting daily ad spend directly to several opportunity rows can multiply cost in either tool. A more capable modeling environment gives the team ways to express the correct relationship; it does not choose the business meaning automatically.
How should you test the same marketing report in both tools?
Use a fixed source period, common metric definitions and representative reader roles, then compare the final answers and operating work. The pilot should reproduce one useful decision report rather than demonstrate every chart type.
- Write the report's business question, currency, timezone, source cutoff and permitted audience.
- Preserve a small accepted source extract with stable account, campaign and opportunity keys.
- Build the same required measures and filters in each candidate configuration.
- Compare source totals, unmatched records and filtered subsets before judging appearance.
- Test refresh, a missing source and ordinary-reader access with the intended credentials.
- Record building time, corrections, recurring work and the complete commercial configuration.
Use this hypothetical grain test. One campaign-day has USD 200 of spend and three distinct opportunities. Joining that spend row directly to the opportunities produces three rows carrying USD 200; summing them reports USD 600. The correct campaign spend remains USD 200.
Do not repair that calculation by summing distinct amount values. If two different campaigns each spent USD 200, the correct combined spend is USD 400; distinct amount values still sum to USD 200. Aggregate each fact at its declared grain and use stable campaign keys and an explicit opportunity-attribution rule.
| Test | Expected evidence | A failure means |
|---|---|---|
| Whole-period spend | Accepted total by currency | Missing source slices, duplicate joins or an incompatible date basis |
| One campaign with several opportunities | Spend counted once at campaign-day grain | The report combines facts at incompatible grains |
| Campaign with no matched opportunity | Spend remains visible under the chosen scope | A join silently removed part of the investment |
| Restricted reader | Only the permitted client's or team's rows | The sharing or source-access design needs repair |
| Late or failed source | Visible incomplete state and owned response | A refreshed chart can still conceal stale inputs |
The Data Studio troubleshooting guide covers wrong totals, credentials and quota failures. If the pilot changes from GA4's reporting API to raw BigQuery export, revalidate the metric definition: those data surfaces need not reproduce every processed or modeled GA4 figure.
How should sharing, credentials and support be tested?
Test the report as the people who will actually use it, including a restricted reader and a person outside the author's usual access context. A working author session is insufficient evidence of a completed handover.
Data Studio can use the credential owner's access, each viewer's access or supported service-account access. Owner credentials can allow report consumption without direct dataset access; that design still needs deliberate sharing and data minimization. Document which identity queries each source. Data Studio credential modes.
For a client-facing report, test two distinct client identities, exported data and an unauthorized path. Define who can change the report, edit a source and administer its credentials. Repeat those tests after moving to a different licence or workspace arrangement.
Pro content can belong to the organization through its Google Cloud project, helping separate continuity from an individual author. Technical support also requires an eligible Google Cloud support plan alongside Pro, so include that arrangement if support access matters to the purchase. Pro content and support.
Do Gemini or Copilot change the purchase decision?
AI assistance matters when it completes a required task with checkable results and an acceptable operating cost. Price the exact feature and entitlement rather than adding a generic AI checkbox to the comparison.
Google describes Pro-enabled assistance for calculated fields and Slides as preview features, currently available without an extra fee for a limited period. Conversational Analytics is a separate experience and does not require that Gemini assistance switch to be enabled. Confirm the selected workflow's data access and charging conditions. Gemini in Data Studio.
Power BI Copilot requires supported paid capacity, such as Fabric F2 or higher or Premium P1 or higher, plus the relevant administrative and regional conditions. A Pro or PPU licence alone is insufficient. F2 eligibility for Copilot does not establish F64's free-reader consumption entitlement. Copilot requirements, reader licensing.
Test one ambiguous metric, one restricted-data question and one known answer. Record the generated formula or selected definition and check its result. Include correction and review time in any productivity estimate.
What do user reviews add to the comparison?
Use user reviews to choose failure cases for the pilot. The ratings describe different, self-selected reviewer populations and cannot establish which tool will work better on your report.
| G2 product page | Displayed rating | Review count | Concern worth testing |
|---|---|---|---|
| Data Studio | 4.4 / 5 | 476 | Reviewers value Google-source sharing and describe difficulties with complex calculations, connections and larger reports |
| Microsoft Power BI | 4.5 / 5 | 1,661 | Reviewers value interactive modeling and Excel workflows while describing advanced DAX learning, refresh expectations and licence complexity |
These are review themes to investigate, not measured performance results for either candidate. A Power BI community licensing discussion also illustrates why the reader test belongs in procurement. Use Microsoft's actual entitlement rules to settle the contract, then test the supported configuration.
What must a migration rebuild or preserve?
A migration should preserve accepted metric meaning, required history and access while rebuilding the tool-specific presentation and calculations. Inventory reports and dependencies before estimating the work.
| Asset | Migration work | Acceptance evidence |
|---|---|---|
| Source connection | Reconfigure authentication, scope and refresh | Same permitted records and usable cutoff |
| Calculated logic | Translate formulas, measures and filter behavior | Same result on fixed positive and edge cases |
| Report experience | Rebuild visuals, controls and navigation | Reader can complete the intended decision |
| Access and delivery | Recreate permissions, schedules and recipient rules | Authorized delivery and denied-access tests pass |
| Historical series | Preserve definition changes and source coverage | Comparable periods or an explicit break in the series |
Keep shared definitions in maintained data models when they need to serve several consumers. Preserve the metric contracts that survive a tool change, including numerator, denominator, dates, exclusions and attribution. Moving logic into a warehouse can reduce repeated work, but the model still needs an owner and a cost estimate.
Run the old and new reports in parallel for the accepted comparison period. Record differences, the reporting cutover and the rollback condition. Retire the old licence only after the remaining reports, exports and scheduled recipients have moved or their owners have agreed to stop them.
Which configuration fits each team scenario?
Choose the lowest-cost configuration that passes the actual report, access and ownership requirements. Team size helps price the configuration; it does not settle the data-model question.
| Situation | First candidate | Runner-up | Deciding evidence |
|---|---|---|---|
| Small author group, many Google-report readers | Data Studio | Power BI Pro | Source coverage and ordinary sharing work without costly extra modeling |
| Microsoft team with existing Pro entitlement | Power BI | Data Studio | Shared measures and reader access fit the current estate |
| Agency with several isolated clients | Data Studio with client-owned access where appropriate | Power BI's supported external sharing or embedding route | Client isolation, licence assignment and handover all work |
| Cross-team financial and operational analysis | Power BI with a maintained model | Data Studio over governed warehouse outputs | Required relationships, calculations and restricted-reader tests pass |
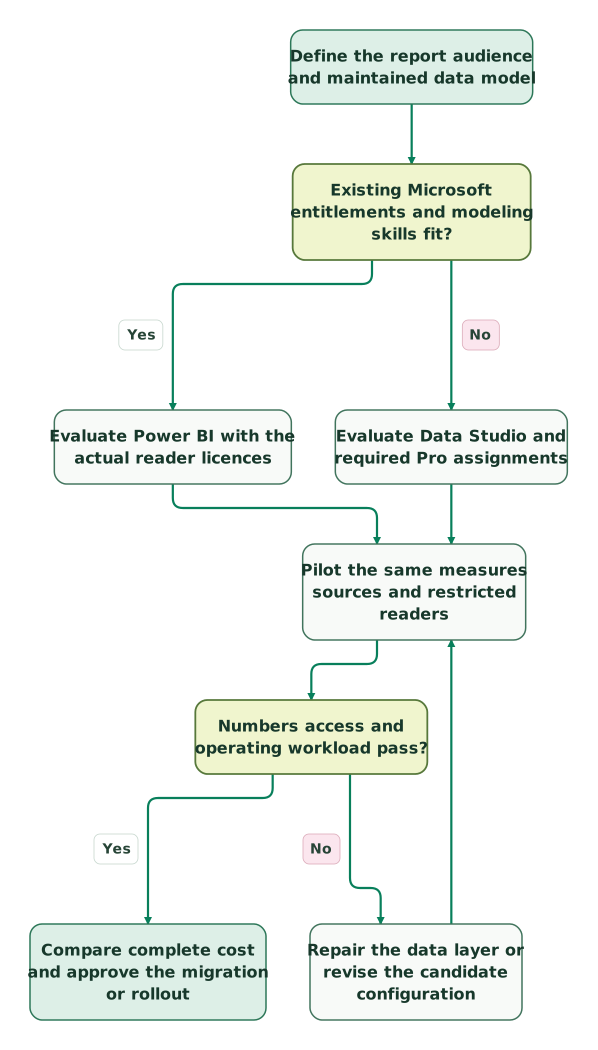
Read diagram as text
- Define the report audience and maintained data model to Existing Microsoft entitlements and modeling skills fit?.
- Existing Microsoft entitlements and modeling skills fit? to Evaluate Power BI with the actual reader licences: Yes.
- Existing Microsoft entitlements and modeling skills fit? to Evaluate Data Studio and required Pro assignments: No.
- Evaluate Power BI with the actual reader licences to Pilot the same measures sources and restricted readers.
- Evaluate Data Studio and required Pro assignments to Pilot the same measures sources and restricted readers.
- Pilot the same measures sources and restricted readers to Numbers access and operating workload pass?.
- Numbers access and operating workload pass? to Repair the data layer or revise the candidate configuration: No.
- Repair the data layer or revise the candidate configuration to Pilot the same measures sources and restricted readers.
- Numbers access and operating workload pass? to Compare complete cost and approve the migration or rollout: Yes
Before committing:
Checklist
- Count builders, maintainers and report-only readers separately.
- Confirm existing Microsoft entitlements and the actual workspace type.
- Price Data Studio Pro assignments per project under the chosen subscription model.
- Name every connector, source account and refresh owner.
- Reconcile a fixed report and the joins behind its totals.
- Test restricted readers, exports and source credentials.
- Include support, data infrastructure, operating time and post-trial costs.
- Preserve metric definitions, old-report dependencies and a rollback route.
Use the two-tool evaluation method to keep the decision tied to that evidence. Get the $99 martech audit if the reporting boundary is unclear, or request a detailed reporting setup scope with the source list, reader roles and report that must work.
Keep reading
Browse all Data Warehouse guides
 Data Warehouse
Data Studio Pricing 2026, Formerly Looker Studio: Free, Pro at $9 and the Real Reporting Budget
Data Studio, formerly Looker Studio, is free. Pro lists $9 per user per project monthly. Compare licences, connector plans and BigQuery reporting costs.
Jafrin Akter AloLast updated 21 min read
 Data Warehouse
Data Studio Problems: Fix GA4 Quota Errors, Wrong Totals and Slow Reports
Fix Data Studio GA4 quota errors, inflated blend totals, wrong ratios and slow reports. Each quota message explained, with the limits and a release checklist.
Jafrin Akter AloLast updated 14 min read
 Data Warehouse
Data Studio Alternatives for Marketing and Revenue Teams
Compare Metabase, Power BI, Looker, Tableau and Superset using real reporting tasks, access tests, operating costs and a controlled migration plan.
Jafrin Akter AloLast updated 10 min read
Data warehouse & CDP
See the implementation scope, deliverables and acceptance checks.
Questions people ask
Can a CSV-only pilot establish which reporting tool fits?
A CSV pilot can compare calculations, chart behavior and the reader's workflow, but it leaves live connection and operating questions unresolved. Add the intended refresh path, credentials and representative source failure before approving production use. Keep the same accepted extract for numerical comparison, then test the real source route separately so connector behavior does not get confused with modeling differences.
Should old report links redirect immediately after cutover?
Redirect or retire them only after the owners accept the replacement and its access rules. Inventory scheduled emails, embedded links, bookmarked reports and downstream exports first. Keep a clear transition notice and the agreed rollback route. A successful new dashboard does not establish that every recipient can open it or that a scheduled process has stopped using the old definition.
How should customer-specific metric exceptions be maintained?
Keep each approved exception explicit in the maintained definition and identify the customers and periods it applies to. Use governed parameters or separate named measures where appropriate, then test both the ordinary and exceptional cases. Copying an entire report for each customer can hide diverging calculations. Preserve the common metric's identity so a client-specific rule does not silently change company-wide totals.
Should a PDF count as successful report delivery?
It can satisfy a deliberately defined static-report requirement when the recipient, period, filters and source cutoff are visible. It cannot establish that interactive filtering, underlying access or the next refresh will work. Test the actual delivery format the business needs and keep its acceptance separate from the live dashboard. A successfully emailed attachment can still contain stale or incorrectly scoped figures.
How should the licence forecast handle a temporary reporting project?
Record the people, projects and access period the work requires, then apply the selected subscription's commitment and reduction rules. A temporary business need does not automatically create a cancellable monthly licence. Check whether existing entitlements can cover the work and who will remove access afterward. Keep any residual annual commitment in the forecast even when the report itself will stop sooner.
Sources
- Google Cloud: Data Studio product and pricing.
- Microsoft: Power BI pricing.
- Microsoft Learn: Power BI service features by licence type.
- Google Cloud: Data Studio Pro subscription overview.
- Google Cloud: Data Studio release notes.
- Google Cloud: Available connectors.
- Google Cloud: How blends work.
- Microsoft Learn: Star schema and Power BI modeling.
- Google Cloud: Data credentials.
- Google Cloud: About Data Studio Pro content.
- Google Cloud: Gemini in Data Studio.
- Microsoft Learn: Copilot for Power BI.
- Microsoft Learn: Publish to web.
- G2: Data Studio reviews.
- G2: Microsoft Power BI reviews.
- Reddit: Power BI reader-licensing discussion.

Written by
Jafrin Akter AloData Engineer and Co-founder at Martechdevs and Growth and Analytics Partners
Jafrin writes practical guides to marketing technology, customer data, analytics and AI workflows. Martechdevs is a Growth and Analytics Partners company.