
Data Studio Problems: Fix Wrong Totals, Quota Errors and Slow Reports
Data Engineer and Co-founder, martechdevs
Last updated 9 min read
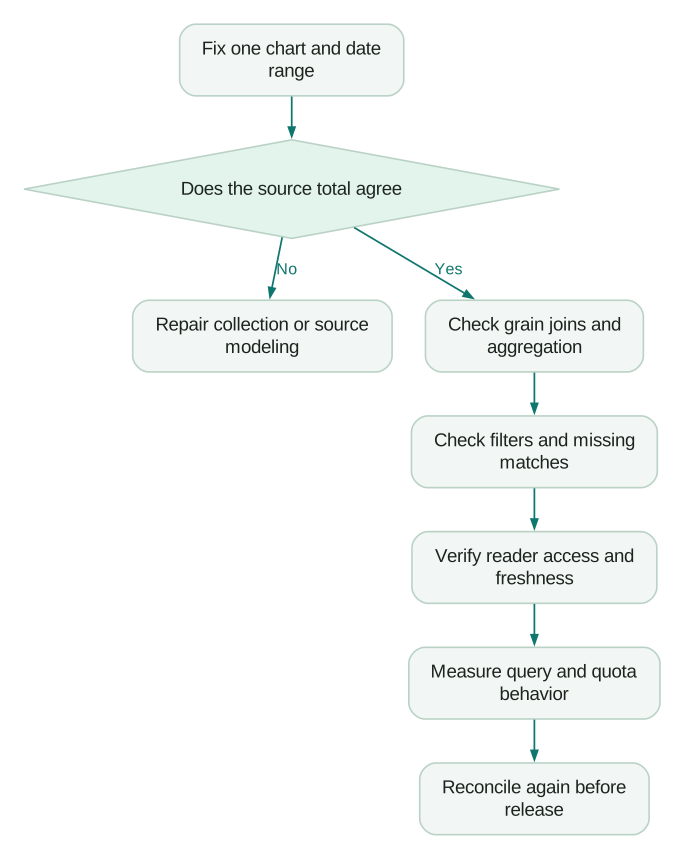
Diagnose a Data Studio report by separating data correctness, access, freshness and query performance. Start with one failing chart, a fixed date range and a known source total. Check its grain, joins, aggregation and credentials before adding more fields or changing platforms. A chart that loads successfully can still answer the wrong business question.
Last updated: 28 September 2026.
Data Studio is the current name for the product previously called Looker Studio. This guide focuses on the reporting problems a marketing or revenue team needs to resolve before trusting it in a budget meeting.
Write down one expected result before opening the editor: “For this campaign and date, spend is USD200 and there are three qualified leads.” Then reproduce that result with the smallest possible chart. Without a reference, debugging can become a sequence of changes that make the number look plausible.
If the disagreement starts before the report, fix the source or model. Our analytics and tracking work helps establish those underlying definitions and checks. The dashboard should present an agreed measurement, not conceal uncertainty about what was collected.
Why does a blend inflate spend or revenue?
Usually, start by checking what one row represents on each side. Daily campaign spend and individual CRM leads have different grains. Joining them without accounting for that difference can repeat the campaign's spend for every lead.
Google's blending documentation explains that Data Studio groups each blend table by its selected dimensions before joining. The selected fields therefore affect the data being joined. Its advanced blending guide also warns that multiple matching rows can expand the result.
Consider a fictional example. The spend table has one row for a campaign on a date, with USD200 of spend. The lead table contains three different lead IDs for that campaign and date. If those lead IDs remain in the blend and each matches the spend row, summing the repeated spend yields USD600. Dividing that by three leads gives a false cost per lead of USD200; the intended campaign-level calculation is USD200 divided by three, or about USD66.67.
A correct repair depends on the output you need:
- For a campaign-day summary, aggregate qualifying leads to that grain before joining to campaign-day spend.
- For a lead-level operational view, keep the lead detail and avoid treating repeated campaign spend as an additive lead measure.
- If allocating spend to leads is a business requirement, define the allocation rule explicitly and reconcile its total to the original spend.
Do not hide the problem by changing SUM to MAX everywhere. That may make one campaign look correct while undercounting totals across multiple campaigns.
Use a join key that represents the entity across accounts and time. A campaign name alone may be renamed or reused. Confirm which stable campaign ID is actually available in both datasets and whether account, platform and date belong in the key. If the CRM only has a free-text UTM value, mapping it to a platform campaign is separate work.
Why does a filter change the answer unexpectedly?
A filter can act before or after a blend. Google's advanced blending guide describes how filters on the blend's component tables affect the data before the join, while filters on a blended chart can affect the joined result. Inherited filters add another layer that needs checking.
For a pipeline report, ask whether “qualified leads only” should remove lead records before they are counted, or filter campaigns after their totals are calculated. Those operations answer different questions.
Build three temporary checks beside the chart you are repairing: the left source on its own, the right source on its own and the final blend. Keep the date range and intended entity scope fixed. Add one filter at a time and record which stage changes.
Also decide what to do with unmatched records. A campaign with spend and no leads should often remain visible in an acquisition report. A lead with no matched campaign may need an explicit unmatched category rather than disappearing from a join. These decisions should be visible in the reporting specification.
The metric contracts guide provides a place to record the grain, eligible population and treatment of missing relationships so the next report uses the same rules.
Why is the overall conversion rate wrong?
An average of percentages often answers a different question from the ratio of total outcomes to total opportunities.
For an illustrative click-through calculation, assume campaign A has ten clicks from 100 impressions and campaign B has 100 clicks from 10,000 impressions:
Campaign A CTR = 10 / 100 = 10%
Campaign B CTR = 100 / 10,000 = 1%

Unweighted average of campaign CTRs = 5.5%
Combined CTR = (10 + 100) / (100 + 10,000)
             = about 1.089%
The 5.5% value gives each campaign equal weight. The combined rate gives each impression equal weight. Neither formula can be chosen simply because it produces a nicer chart; the metric definition determines which population should count.
With an additive reporting table that contains clicks and impressions at the intended grain, calculate the ratio from the summed components. Handle a zero denominator explicitly. Validate the result at campaign, date and grand-total levels.
Do not apply that recipe blindly to an already aggregated connector field. Google's ratio-metric error guide explains that some Google product metrics arrive pre-aggregated, and certain calculated-field filters can require a reaggregation the connector cannot perform. Change the supported filter or use suitable base measures and a controlled data model; do not relabel another metric as the requested rate.
What should you do when GA4 quotas are exceeded?
The native GA4 connector uses the GA4 Data API and is subject to its quotas, as documented in the connector reference. An error should be investigated as a request or quota problem, not automatically treated as missing tracking data.
Use the Google Analytics token usage dialog in report edit mode. Google documents access by right-clicking the report canvas or a specific chart. It shows token use, remaining quota and whether chart queries used cached results or queried GA4.
Test the report in the way people actually use it: initial load, a longer date range, a campaign filter and another page. Find which interaction creates expensive or numerous requests. A simple default view can conceal a costly executive filter.
Then reduce unnecessary work. Remove charts that repeat the same decision, reuse appropriate data sources and split unrelated analyses into purposeful pages. Avoid putting a live operational report on a widely accessible page without considering the audience and request load.
Changing credentials to share cached results is not merely a performance adjustment. Review who will be able to see the underlying data before changing access behavior. Performance does not justify granting broader visibility than intended.
For repeated complex analysis, a modeled BigQuery dataset may be appropriate. It introduces storage, query and maintenance costs, and you must recreate the desired definitions. It is not a promise of exact parity with every GA4 interface metric. Use the GA4 BigQuery session guide when session definitions are part of that work.
Does a fresh report mean the source is up to date?
No. The report can query successfully while the source extraction or transformation is behind.
Google's freshness documentation describes temporary reuse of query results. A new query or an expired freshness interval can fetch data again. Report auto-refresh and source freshness are separate settings. Refreshing a page does not force an upstream API to finish processing yesterday's conversions.
Track three times where they matter: the latest business period considered complete, the latest successful source or model update, and the report's last data refresh. A single “updated just now” label is misleading if it only describes rendering.
For example, a marketing report might show source data loaded at 08:00 while clearly marking the current day as provisional. Its final daily comparison should use completed periods on both sides. A live partial day compared with a full prior day can look like a performance collapse.
Define a data freshness agreement around the decision deadline. A weekly board report and an hourly campaign-monitoring view need different delivery expectations. Make the stale state visible instead of silently showing an old number under today's date.
Why can the creator see a report that colleagues cannot?
Check both report sharing and data credentials. Google distinguishes owner, viewer and service-account credentials. With viewer credentials, readers need their own underlying data access; owner credentials can let shared-report readers access the data through the owner's authorization.
Reproduce the failure with a representative reader account. Confirm the report is shared correctly, the selected source identity is valid and the required dataset permissions exist. Do not test only from an administrator session.
Then test the departure scenario. If the current source owner loses access or leaves the organization, who can reauthorize the connection? Document a replacement path for third-party connectors as well as Google sources.
Organization-owned Pro content can address part of the asset ownership problem, but it is not a substitute for checking every source authorization. The Data Studio pricing guide separates those responsibilities and the associated costs.
How can you make a slow report easier to diagnose?
Use a copy and change one factor at a time. Keep the original report available while you test. Record the chart, source, date range, filter state, credentials mode, load behavior and any error message.
Begin with one dimension and one metric. Add the date range, filters and blend step by step until the problem appears. This produces an evidence trail that distinguishes a slow source query from a problematic combination of report settings.
For BigQuery-backed reports, inspect the generated workload in the warehouse. Google's connector guide supports tables, views and custom queries and recommends using appropriate partition date filters. A report over a prepared daily summary may require far less work than repeatedly grouping raw event history.
Measure the complete interaction after each change. A fast first page is insufficient if opening the 12-month view is still unusable. Also retest correctness; reducing the date range or dropping a join can improve speed while changing the question.
If many reports independently rebuild the same complex business logic, move the reusable definition into a maintained model where it can be tested once. Keep report-specific presentation choices in the report. That reduces the number of places where a revenue rule can drift.
What should a report pass before a team relies on it?
A useful release check follows real decisions rather than counting how many charts have been built.
Checklist
- A known campaign or account matches its source total for a fixed completed period.
- Grand totals remain correct after grouping and blending.
- Zero-outcome and unmatched records receive an intentional treatment.
- Rates use the intended denominator and aggregation rule.
- Common filters and date ranges preserve the expected population.
- A normal reader can access exactly the intended data.
- Stale or provisional data is clearly identified.
- Typical and broad report interactions have been checked for load and quota behavior.
Keep the expected results with the report's handover notes. Re-run them when a source field, connector, blend or metric definition changes. This turns the dashboard from a one-time design deliverable into a report the business can continue to trust.
Questions people ask
Why does my Data Studio report not match GA4?
First align the property, date range, metric, dimensions and filters. The GA4 connector documentation also distinguishes reporting data from explorations, so not every interface comparison represents the same query. Reduce the comparison to one metric and add complexity only after the base result is understood.
Can a blend duplicate values even when the join key looks correct?
Yes, when a key matches multiple rows at the selected grain. Check the dimensions included in each component table and the relationship between the datasets. A key that identifies a campaign does not automatically identify an individual lead or order.
Should I average daily conversion rates for a monthly report?
Only if equal weighting of days is the intended metric. For an overall conversion rate, the usual calculation uses total conversions divided by the corresponding total eligible population. Keep the numerator, denominator and period aligned, and check whether the connector provides suitable additive components.
Will automatic page refresh resolve stale data?
It cannot guarantee that upstream collection, extraction or modeling has completed. Identify which stage is stale and show a meaningful completion timestamp. Adjust the schedule at that stage rather than repeatedly refreshing an unchanged result.
When should I move calculations out of the report?
Consider doing so when multiple reports reuse the same complex definition, when joins need systematic validation or when report interactions repeatedly query unnecessary raw history. Maintain a tested model with a clear owner and grain. Keep simple presentation calculations local when that is easier to understand and maintain.
Sources
- How blends work in Data Studio, accessed 28 September 2026.
- Blending tips and advanced concepts, accessed 28 September 2026.
- Ratio metric aggregation errors, accessed 28 September 2026.
- Connect to Google Analytics, accessed 28 September 2026.
- Troubleshoot errors and inspect GA4 quota usage, accessed 28 September 2026.
- Manage data freshness, accessed 28 September 2026.
- Data credentials, accessed 28 September 2026.
- Connect to Google BigQuery, accessed 28 September 2026.
Written by
Jafrin Akter AloData Engineer and Co-founder, martechdevs
Jafrin Akter Alo is a data engineer and co-founder of martechdevs, where the team has delivered 74+ martech, data and growth stack implementations.