
Marketing data warehouse: what goes in, what comes out
Data Engineer and Co-founder, martechdevs
Last updated 13 min read
A marketing data warehouse brings campaign, customer, product and commercial data into models your team can use to make decisions. Its value comes from connecting those records consistently: which campaigns brought suitable customers, what those customers did, what they paid and which action should happen next. Start with one decision, define the numbers with their owners and build the smallest reliable path from source records to an agreed output.
Last updated: 9 September 2026.
The dashboard says paid marketing generated $120,000. Finance reports $103,000 arriving in the payment balance. Sales shows $150,000 in signed contracts. Before anyone rebuilds the dashboard, establish what each number measures.
Those figures can all be correct. They can also hide duplicate transactions, missing refunds or a join that multiplies revenue. A useful warehouse makes the distinction visible and gives someone a way to investigate it.
This guide describes a practical architecture for a SaaS business. Ecommerce teams can use the same approach with orders, fulfilment and returns in place of subscriptions and workspaces.
Start with a decision and a reconciliation target
Write down the recurring decision the warehouse must improve. “Understand our customers” leaves almost every design choice open. “Compare acquisition channels by the number of new paying accounts and their first 90 days of collected payments” sets a useful boundary.
For that question, agree on:
- The unit: commercial account, rather than every contact or workspace belonging to it.
- The cohort: accounts whose first successful payment occurred within a specified period.
- The outcome window: the first 90 days after that payment, with immature cohorts identified.
- The channel rule: a documented attribution policy, including an unknown category.
- The money definition: currency, successful payments, refunds and exclusions.
- The decision owner: the person who can change the channel budget after reviewing the evidence.
Choose a trusted source report to reconcile against before producing channel breakdowns. If the warehouse cannot reproduce the agreed payment total, slicing it into twenty campaigns makes the defect harder to see.
Record the question and its limitations beside the output. An attributed payment report describes how your rule allocates observed money. It does not establish what would have happened without advertising.
Bring in the sources the decision actually needs
Eight source groups cover many marketing use cases. They are a planning inventory, not eight mandatory integrations on day one.
- Advertising platforms: campaign IDs, account IDs, spend, impressions, clicks and separately labelled platform conversion measures. Preserve the platform's currency and reporting date.
- Website and app measurement: observed events, acquisition parameters and session context where available and permitted. These records explain behaviour but may not cover every visitor or transaction.
- CRM: accounts, contacts, opportunities, ownership, lifecycle changes and commercial relationships. Historical stages matter when analysing a past pipeline.
- Product database and events: users, workspaces, memberships, plan access and meaningful product outcomes. Keep test environments identifiable.
- Billing or commerce: subscriptions, invoices, successful payments, refunds, cancellations and order details. Preserve distinct IDs for distinct financial objects.
- Messaging tools: campaign delivery, clicks, subscription preferences and journey participation. Define which signals are credible evidence of engagement.
- Support and customer success: issues, severity, resolution, renewal context and recorded intervention outcomes. Restrict free-text material to uses that need it.
- Finance and reference data: approved commercial measures, exchange-rate policy, campaign taxonomy, product catalogue and reporting calendar.
For a first acquisition-to-payment report, advertising, CRM or product identity, billing and reference data may be enough. Add support when a specific retention question needs it.
A connector's existence does not prove that it supplies the right history, deleted records, custom objects or refresh schedule. Inspect its documented coverage and compare a sample export with the source application.
For example, Google's Google Ads transfer documentation describes daily transfers, a default seven-day refresh window and configurable retrieval up to 30 days. Repeated transfers overwrite the relevant date partition. Plan for those behaviours rather than assuming that every connector streams changes or only appends rows.
Separate raw records, reusable models and business outputs
Use three conceptual layers even if the first implementation contains only a few tables.
The source layer preserves enough original data and ingestion metadata to investigate a discrepancy. It should show which system produced a row, its source identifier and when it arrived. Apply an explicit retention policy; “raw” does not mean keeping every sensitive field forever.
The modelling layer standardises types, resolves known relationships and defines business facts. This is where an account ID becomes consistent across billing and CRM, and where a successful payment is distinguished from an invoice being created.
The output layer exposes data for a particular job: a channel report, a renewal review, an audience or an approved AI query. Give each output a clear grain, owner and freshness requirement.
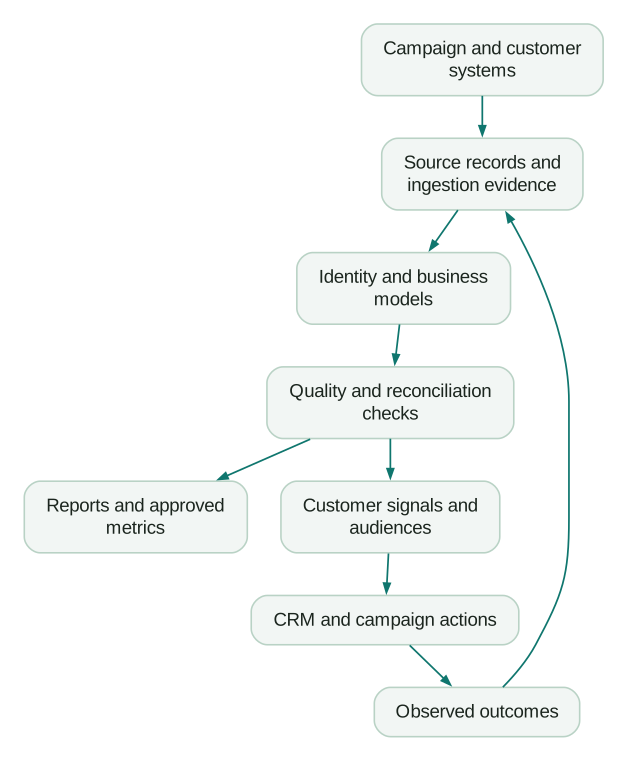
The return path matters. If the warehouse sends an onboarding signal to a messaging tool, collect whether the message was eligible, delivered and followed by the intended outcome. Otherwise, the system can produce activity without supporting evaluation.
Define the grain of each model before joining it
The grain states what one row represents. Write it into the model description and test it. Ten useful model types are listed below; smaller implementations can combine or defer them where the meaning remains clear.
- Campaign directory: one row per source platform, advertising account and campaign ID. Keep names as attributes because they can change.
- Campaign spend: one row per documented reporting grain, such as platform, account, campaign, source date and currency. Additional device or placement breakdowns change that grain.
- Person directory: one row per internal person ID, with separate mappings to source identifiers.
- Account and membership model: accounts plus the dated relationships linking people and workspaces to them. Represent a many-to-many relationship explicitly.
- Product activity: one row per qualifying event or per declared aggregate interval. Store the event definition and deduplication key.
- Opportunity history: one row per opportunity change or dated snapshot, supporting analysis of the state known at the time.
- Subscription history: subscription status, plan and effective intervals. A current status alone cannot reconstruct last quarter's customer base.
- Payment and adjustment facts: distinct transactions linked to the relevant customer and, where supported, invoice or order. Keep payments, refunds and fees distinguishable.
- Acquisition allocation: the observed touchpoints or channel assignments associated with the chosen conversion unit, including the rule version and unassigned cases.
- Activation output: one current row per destination entity, containing approved fields, eligibility, reasons and timestamps needed for an operational action.
Do not join campaign spend directly to every customer event and then sum the spend. A campaign with one daily spend row and 200 events would repeat that spend 200 times. Aggregate each side to a compatible grain or allocate the amount through an explicit weighting model.
The single customer view guide works through the same failure with invoices and product events. The issue is structural; adding DISTINCT to a sum does not establish which rows should exist.
Connect spend to revenue without hiding the unknowns
Keep identity, channel classification and attribution as separate steps.
Identity answers which account a payment belongs to. Classification turns observed campaign parameters into a usable taxonomy. Attribution assigns credit under a chosen rule. Failure in one step should not silently become confidence in the next.
Use source IDs, captured campaign parameters and documented relationships where available. A campaign's name is a weak join key. Joining a signup to whichever campaign spent money that day is not evidence that the campaign acquired it.
For a single-credit model, require one assignment per conversion unit, including an explicit unknown assignment. For a fractional model, test that weights sum to one within the chosen creditable unit, subject to a documented numerical tolerance. Keep model versions so a reporting change does not look like business growth.
Consider an illustrative monthly cohort of 20 new paying accounts. Twelve are assigned to paid search, five to paid social and three remain unknown. Search spend is $6,000 and social spend is $4,000.
The assigned paid-media cost per new account is $500 for search and $800 for social. Across the 17 accounts assigned to paid channels, it is approximately $588.24. Dividing all $10,000 by all 20 accounts gives $500, but that is a different, blended measure which includes the unassigned accounts in its denominator.
None is automatically full customer acquisition cost. Sales salaries, agency fees and other acquisition costs may be outside this example. Nor does the difference establish that moving money from social to search will create more customers. Channel mix, lag, customer quality and unobserved demand still matter.
Show the three unknown accounts in the report. Hiding them improves the appearance of attribution while making the decision less trustworthy. The attribution model guide explains how to choose and communicate the credit rule.
Reconcile money before comparing dashboards
Return to the opening example. Suppose the $150,000 figure represents contracts signed during the month. The $120,000 figure represents invoices issued. Successful payment receipts in the chosen period total $110,000. Refunds of $4,000 and processing fees of $3,000 reduce the net balance impact of those included activities to $103,000.
This is illustrative arithmetic, with no other adjustments and all values in USD. It explains a possible difference; it does not prove that any particular report is correct or define accounting revenue.
If bank payouts during that period total $98,000, the remaining $5,000 can stay in the payment balance under those assumptions. Opening balances, payout timing, disputes, reserves and other activity would change the reconciliation in a real account.
Stripe's Balance summary report separates starting and ending balances, activity and payouts. Its activity reports distinguish gross amounts, fees, net amounts and currency. Preserve those distinctions when modelling the source, and have finance specify the revenue measure used for management reporting.
Give every money field a unit. A field in minor currency units and a CSV export in major units can differ by a factor of 100 for USD. Currency codes alone do not tell you which representation a connector used.
For multiple currencies, retain the original amount and currency alongside the converted amount, exchange-rate source and applicable date. Do not silently mix a transaction-date conversion with today's rate.
Make time and completeness part of the metric
A report can be internally consistent and still compare incomplete periods. Distinguish when an event occurred, when the source recorded it, when the warehouse received it and when the model finished processing it.
Google documents that GA4's BigQuery export contains raw event data and can differ from the Analytics interface. Streaming export is best effort and can contain gaps. Daily tables can receive late events, with historical reprocessing also possible. A warehouse query should therefore state its reporting cutoff and completeness assumptions.
For a daily acquisition report, a useful output contract might say:
metric: new_paying_accounts_by_acquisition_channel
version: 1
entity: commercial_account
cohort_entry: first_successful_payment_at
reporting_timezone: UTC
channel_policy: first_observed_eligible_campaign_v1
unmatched_channel: unknown
exclude: [internal_accounts, test_accounts]
source_cutoff: latest_verified_complete_source_period
owner: growth_operations
reconciliation_owner: finance
This is a documentation template, not executable vendor configuration. Specify the actual campaign eligibility and observation rules before implementation.
Publish when the required inputs have passed their checks, rather than assuming that several independently scheduled jobs will finish in the right order. If a source is stale, label the affected output and choose whether to hold it, use a previously verified version or disable dependent actions.
Test the meaning as well as the pipeline
Start with uniqueness, required fields, permitted values and valid relationships. dbt's data tests support these checks and allow custom assertions that return failing rows.
Then add checks tied to the business question:
- Payment totals reconcile to the agreed source report under the same currency and cutoff rules.
- Every acquisition assignment resolves to an eligible account; duplicate assignments are detected.
- Unknown-channel and unmatched-identity rates remain visible by source and period.
- Reprocessing a completed interval does not duplicate events or money.
- A refund updates the intended reporting period and related customer measure.
- A campaign rename does not create a second campaign identity.
- A missing feed does not turn missing activity into a confident zero.
Test small fixtures with known answers, including a refund, two currencies, a late event and an account with two workspaces. Inspect both totals and individual rows; offsetting errors can produce the correct grand total.
Freshness also needs an explicit check. dbt's source freshness documentation notes that dbt build does not itself include source freshness checks. In hosted jobs, selecting the freshness checkbox runs the check but does not stop subsequent steps on failure. If stale inputs must block the build, add dbt source freshness as the first run step and verify the failure path. A green model build can otherwise sit on yesterday's source data.
Design five outputs with different operating requirements
Management reporting needs stable definitions, reproducible periods and reconciliation. Include a drill-down path to underlying records and an explanation of revisions.
Audiences need current membership, a destination identifier, eligibility and a removal policy. A filtered query alone does not ensure that yesterday's audience member is removed from the destination.
Attribution analysis needs visible assumptions and coverage limits. Keep platform-reported conversion metrics separate from your own allocation model so readers can compare them honestly.
AI-assisted analysis needs approved models, definitions, permissions and a way to inspect evidence. Exposing every raw table to a language model does not settle what “active customer” means. The AI-ready marketing data guide covers the preparation; the semantic layer guide shows how to reuse approved metrics and verify that an agent actually uses them.
Lifecycle signals need an action owner, a reason, freshness and protection against duplicate or inappropriate actions. See reverse ETL for the delivery contract between a warehouse model and a business application.
Use the strictest requirements of each output where they belong. A monthly cohort report and a payment-failure intervention should not inherit the same refresh schedule by accident.
Assign ownership and release a complete first workflow
Marketing should own the decisions and campaign taxonomy. Finance should own agreed financial definitions. Product or engineering should own the meaning of product events. Data engineering or analytics engineering should own models, tests and pipeline operation. Name people for the first release, even when one person fills several roles.
Choose infrastructure that the team can operate and that fits the sources, cloud environment and workload. If an existing warehouse already meets those needs, reuse it. Starting another platform adds access, cost and maintenance decisions without necessarily improving the report.
For product analysis, compare direct warehouse queries with importing records into another analytics engine. The warehouse-native analytics guide explains how execution location, cached results, freshness and operating effort affect that choice.
Budget for connectors, storage, query compute, transformation, monitoring and maintenance. Also include destination software and activation when they are part of the promised outcome. A cheap warehouse query does not make the whole workflow cheap.
Use these acceptance checks for the first release:
Checklist
- One recurring decision and its accountable owner are documented.
- Source coverage, identifiers, history and reporting units have been checked.
- Model grains and relationship cardinalities are explicit.
- Money reconciles before channel or cohort breakdowns are published.
- Time zones, completeness, late data and revisions have defined handling.
- Unknown and unmatched records remain visible.
- Tests include realistic failure cases and an assigned response owner.
- Permissions and retention match the fields each output needs.
- At least one user has completed the intended decision using the output.
- The operating cost and maintenance owner are recorded.
Expand after the first output survives a reporting cycle and a correction. If the main difficulty is connecting sources, agreeing on models or delivering trusted customer signals, our data warehouse and CDP work can help define and implement that first complete workflow.
Questions people ask
What data should a marketing warehouse hold?
Hold the sources needed for named decisions, with stable identifiers and enough history to explain them. Acquisition reporting often starts with advertising, customer identity, billing and reference data. Product, messaging and support records become useful when a specific activation or retention workflow needs them. Collecting everything creates cost and responsibility without guaranteeing better decisions.
How do I connect advertising spend to revenue?
Reconcile spend and commercial measures separately, map customer identities, then apply a documented attribution rule using observed evidence. Preserve unknown cases and test the reporting grain before joining. Report whether the denominator is paid-channel customers, all new customers or another cohort, and distinguish attributed revenue from incremental revenue.
Is BigQuery or Snowflake better for a marketing warehouse?
Evaluate the existing cloud environment, team skills, connectors, expected workloads, access requirements and total operating cost. Either choice still requires explicit identity, money and time definitions. Run a representative workload and inspect its maintenance requirements before treating a platform choice as the solution to inconsistent reporting.
Do I need a CDP as well as a warehouse?
Only if the required customer-data functions justify it. A warehouse can support reporting without a CDP. Identity management, marketer-facing audiences, activation and operational controls may be supplied through a packaged platform, composable services or focused integrations. The composable CDP guide explains how to compare those responsibilities.
Who should own the marketing warehouse?
Assign a technical owner for reliability and named business owners for definitions and decisions. Marketing cannot outsource campaign meaning to a connector, and engineering cannot determine accounting revenue from a field name. Shared ownership works when each model and output has a clear decision-maker and an operational contact.
Sources
Written by
Jafrin Akter AloData Engineer and Co-founder, martechdevs
Jafrin Akter Alo is a data engineer and co-founder of martechdevs, where the team has delivered 74+ martech, data and growth stack implementations.