
Power BI vs Tableau: Prices, Licenses and Best Fit by Team Size
Pick Power BI for a Microsoft-centered reporting workflow that fits Pro or a properly sized Fabric capacity. Pick Tableau when its visual-analysis workflow, native Mac authoring or required Tableau deployment makes the extra cost worthwhile. Power BI Pro is $14 per user monthly; Tableau Standard uses $75 Creator, $42 Explorer and $15 Viewer roles, all billed annually.
On this page
Power BI vs Tableau at a glance
US list prices in USD per user per month, billed annually; Tableau prices are its Standard edition unless marked.
| Criteria | Power BI | Tableau |
|---|---|---|
| Report builder license | Pro, $14 | Creator, $75 |
| Browser editor license | Pro, $14 | Explorer, $42 |
| Report viewer license | Pro at $14, or eligible Free viewers on F64+ | Viewer, $15 |
| Higher tier | Premium Per User, $24 | Enterprise: $115 Creator, $70 Explorer, $35 Viewer |
| Large audiences | Fabric F64 at $5,002.67 a month reserved | Capacity-based Viewer Blocks, quote only |
| Desktop app | Windows only | Windows and Mac |
| AI assistant | Copilot, needs an F2 or larger capacity | Tableau Agent, with Cloud+ and the Tableau+ Bundle |
| Self-hosted option | Power BI Report Server | Tableau Server |
Power BI's seat prices come from Microsoft's Power BI pricing page. Tableau's Creator, Explorer and Viewer prices come from Salesforce's Tableau page, billed annually, and the Enterprise rates from Tableau's Cloud pricing page. The F64 figure is 64 CUs at $938 a year each on Microsoft's retail price list for East US, divided by 12.
The base author-seat difference is large, but the two prices do not promise identical capabilities or model limits. Power BI Pro covers building, sharing and reading within its plan limits; Tableau separates those responsibilities by role. Price the editions and roles that pass the actual reporting task before deciding whether the difference is useful savings.
Power BI vs Tableau cost by team size
These worked examples use US list prices with annual billing: Power BI Pro for everyone, against Tableau Standard with the role mix shown. The 1,000-person row puts Power BI on an F64 reservation in East US with Pro for 40 authors. Swap in your own mix.
| Team size | Tableau role mix | Power BI monthly | Tableau monthly | Tableau extra a year |
|---|---|---|---|---|
| 5 people | 1 Creator, 1 Explorer, 3 Viewers | $70 | $162 | $1,104 |
| 10 people | 1 Creator, 2 Explorers, 7 Viewers | $140 | $264 | $1,488 |
| 25 people | 2 Creators, 5 Explorers, 18 Viewers | $350 | $630 | $3,360 |
| 50 people | 3 Creators, 10 Explorers, 37 Viewers | $700 | $1,200 | $6,000 |
| 1,000 people | 10 Creators, 30 Explorers, 960 Viewers | $5,562.67 | $16,410 | $130,168 |
The arithmetic behind the rows:
- 25 people: Tableau is 2 × $75 + 5 × $42 + 18 × $15 = $630 a month. Power BI is 25 × $14 = $350.
- 1,000 people: Power BI is $5,002.67 for the F64 reservation plus 40 × $14 = $560 for authors. Tableau is 10 × $75 + 30 × $42 + 960 × $15 = $16,410 with per-user Viewers.
- Tableau Enterprise: at $115, $70 and $35, the 25-person team costs $1,210 a month. Tableau's license guide says editions can't be mixed within a deployment, so one Enterprise need moves every user up.
The large row assumes F64 can serve the models, refreshes and peak query concurrency. Validate that workload before buying it; a larger required capacity changes the comparison. Eligible Power BI Free users need the Viewer role and content on qualifying F64+ capacity, while authors still need Pro or PPU. Fabric licensing. Tableau offers capacity-based Viewer Blocks at a quoted price, so request that alternative before using the $16,410 role-based subtotal. Tableau Cloud pricing.
In the stated 25-person mix, $630 is exactly 80% above $350. That result applies to two Creators, five Explorers and eighteen Viewers; it is not a general Tableau premium. Also deduct Power BI Pro seats already included in Microsoft 365 E5 or Office 365 E5 before comparing incremental purchases. Included Pro licences.
A Fabric reservation is a commitment for matching capacity use. It excludes storage and networking, and its expiry can return continuing workloads to pay-as-you-go rates. Include those costs and the renewal decision in the model. Fabric reservation coverage.
None of these rows include the warehouse, connectors or the work of building reports. If you'd rather have the warehouse models and first dashboards built for you, our data warehouse and reporting service does that on either tool. Our Power BI pricing and licensing guide and Tableau pricing guide go deeper on each bill.
Tableau vs Power BI features that decide it
Use the lowest-cost configuration that meets the required authoring, data-access and reporting workload. A cheaper seat is useful only when the model, refresh schedule and security design fit its limits.
- Desktop app: Power BI Desktop needs Windows 10 or Windows Server 2016 or later, per Microsoft's Desktop requirements. Mac users can build reports in the Power BI service in a browser, or run Desktop on Windows 365 or Azure Virtual Desktop.
- Tableau on a Mac: Tableau Desktop installs on Windows or Mac and has run natively on Apple Silicon since the 2024.2 release, per Tableau's install guide.
- Roles: Tableau's Creator license includes Desktop and Prep Builder, Explorer edits in the browser using published data, and Viewer reads and filters, per the license guide. Power BI's Pro license covers all three jobs.
- AI assistant: Copilot for Power BI needs a paid F2 or larger capacity, and Pro alone isn't enough. Tableau Agent comes with Tableau Cloud+ and the Tableau+ Bundle.
- MCP servers: Microsoft documents a Power BI Authoring MCP server for building semantic models and points question answering to Fabric IQ. Tableau MCP is Tableau's official open-source server, hosted for Tableau Cloud, though some tools need Tableau+.
- Embedding in your product: Power BI Embedded comes with every F SKU, per Microsoft's Premium migration FAQ. Tableau's Embedded Analytics license is metered by analytical impressions and can't share an environment with full-use licenses.
- Self-hosting: Power BI Report Server comes with a Fabric capacity reservation or SQL Server Enterprise with Software Assurance. Tableau Server runs on one computer or a multi-node cluster, with role-based or core-based licenses.
- Contract: Microsoft lists Pro and PPU as paid yearly, and Salesforce's analytics pricing says its Tableau editions need an annual contract.
Power BI and Tableau decision blocks
Power BI for Microsoft 365 companies
- Best for: companies on Microsoft 365 that want shared dashboards for many people at a low price per head.
- Pros: one $14 Pro seat covers building, sharing and reading; free viewing on F64 for large audiences; Pro is included in Microsoft 365 E5.
- Cons: Desktop is Windows only, content in a Premium Per User workspace only reaches PPU users, and capacity needs someone to watch it.
- Free plan and startup offer: Power BI Desktop and the free license for personal reports, and a 60-day Fabric trial. Microsoft for Startups offers Azure credits, but its page doesn't name Power BI.
- Choose it if: most people only read reports, you already pay for Microsoft 365, or you'll have hundreds of readers.
- Skip it if: your report builders work on Macs and won't author in a browser or on a remote Windows desktop.
Tableau for visual analysis and Salesforce teams
- Best for: analyst teams that explore data visually, and businesses that run on Salesforce.
- Pros: Desktop on Windows and Mac, Prep Builder included with Creator, and a cheaper $42 Explorer role for people who edit in the browser.
- Cons: a Creator costs over five times a Power BI Pro seat; one Enterprise need moves every user up; Tableau+ and Viewer Blocks are quote only.
- Free plan and startup offer: Tableau Desktop Free Edition handles one person's private analysis but can't publish or share, per Tableau's edition comparison. Salesforce offers a Tableau Cloud trial; its Tableau pages show no startup price.
- Choose it if: two or more analysts spend their day exploring data, or your required reporting workflow is already built around Tableau.
- Skip it if: most of the audience only reads fixed dashboards and price per person decides it.
Power BI vs Tableau best fit by scenario
Use the deployment requirement and operating constraints to choose the first candidate for a trial.
| Company size or model | Best fit | Runner-up | Reason |
|---|---|---|---|
| 10-person SaaS on Microsoft 365 | Power BI Pro | Tableau Standard | $140 a month covers everyone; Tableau is a weaker fit on price at $264 |
| Team requiring native Mac desktop authoring | Tableau Standard | Power BI browser or supported remote Windows setup | Compare required preparation and authoring tasks, not laptop count alone |
| Salesforce team evaluating CRM-native analytics | Included Tableau Next scope first | Power BI or separately licensed Tableau Cloud | Tableau Next and Tableau Cloud are different products; confirm actual entitlements and report requirements |
| Large internal viewing audience | Sized Fabric capacity versus Pro seats | Tableau with Viewer Blocks | Verify peak load, existing Pro entitlements and the quoted Viewer Block capacity |
| SaaS product showing reports to customers | Power BI Embedded on an F SKU | Tableau Embedded Analytics | Embedded comes with every F SKU; Tableau meters impressions at a quoted price |
| Company that must self-host | Tableau Server | Power BI Report Server | Report Server needs a Fabric reservation or SQL Server Enterprise with Software Assurance |
Salesforce completed its acquisition of Tableau on 1 August 2019, and the Tableau+ Bundle includes Tableau Next, a Salesforce org and a Data 360 instance. On Salesforce's analytics pricing, Tableau Next starts at $40 per user a month, and the full Tableau Next platform is included in the Core, Advanced and Max editions of Sales, Service and Industry Clouds.
For an ordinary internal dashboard workflow that passes Pro's model and refresh limits, we'd begin with Power BI, especially when the team already owns Pro through E5. We'd pick Tableau when a representative pilot proves its authoring workflow or required deployment justifies the extra cost. Company headcount and a Salesforce subscription alone do not settle that decision.
Tableau Next included with a Salesforce package does not automatically grant the Tableau Cloud Creator, Explorer and Viewer subscriptions priced above. The Tableau+ Bundle combines the products, while a standalone Tableau Cloud deployment has its own licensing. Keep those two purchases separate in the quote. Tableau product and bundle boundaries.
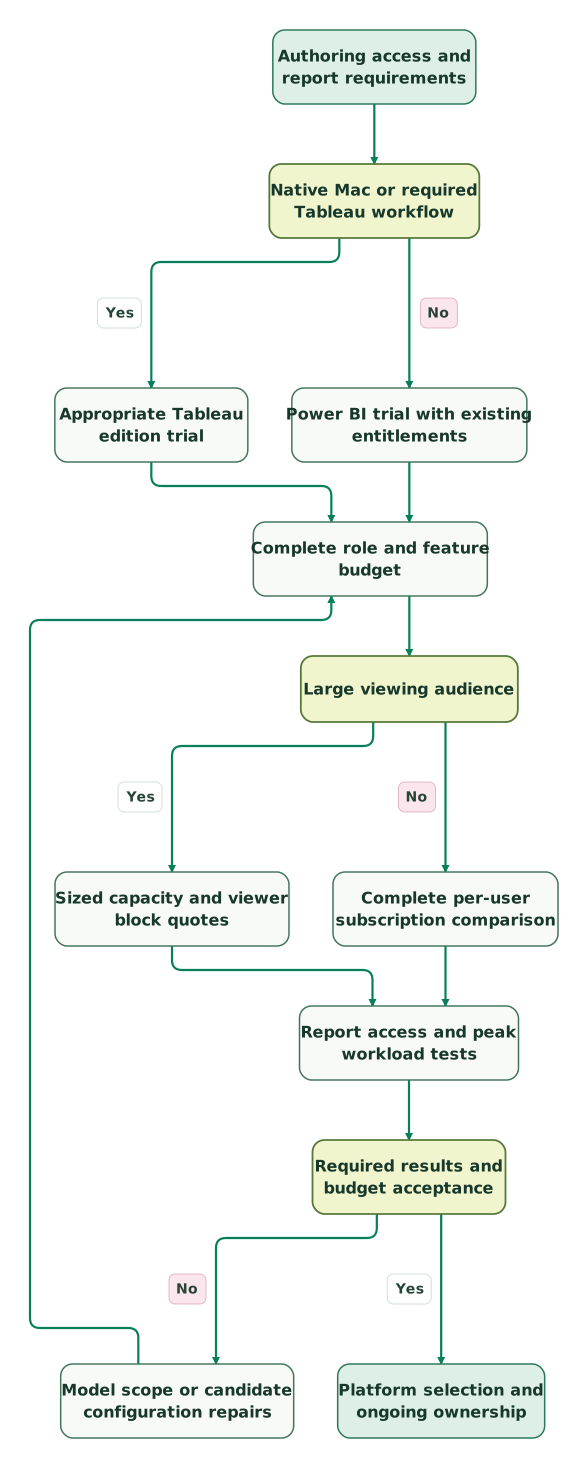
Read diagram as text
- Authoring access and report requirements to Native Mac or required Tableau workflow.
- Native Mac or required Tableau workflow to Appropriate Tableau edition trial: Yes.
- Native Mac or required Tableau workflow to Power BI trial with existing entitlements: No.
- Appropriate Tableau edition trial to Complete role and feature budget.
- Power BI trial with existing entitlements to Complete role and feature budget.
- Complete role and feature budget to Large viewing audience.
- Large viewing audience to Sized capacity and viewer block quotes: Yes.
- Large viewing audience to Complete per-user subscription comparison: No.
- Sized capacity and viewer block quotes to Report access and peak workload tests.
- Complete per-user subscription comparison to Report access and peak workload tests.
- Report access and peak workload tests to Required results and budget acceptance.
- Required results and budget acceptance to Model scope or candidate configuration repairs: No.
- Model scope or candidate configuration repairs to Complete role and feature budget.
- Required results and budget acceptance to Platform selection and ongoing ownership: Yes
Migration between Power BI and Tableau
Moving either way means rebuilding reports. Re-express Tableau calculated fields in the appropriate Power BI model or DAX measures, and translate Power BI measures into the appropriate Tableau calculations in the other direction. Filter context, level-of-detail rules and relationship behavior need explicit tests; copying the arithmetic alone can change totals. Access rules are rebuilt too, so test them with real user accounts before anyone loses the old tool.
Shared business definitions can reduce migration work. When revenue, pipeline and churn are defined once in warehouse tables, the reports become a thin layer that's quicker to rebuild. We'd do that work first, then run both tools side by side for one reporting cycle and check every total against finance.
Time the switch around renewals. Microsoft lets Customer Agreement accounts remove licenses only within seven days of buying or renewing, per its license management guide, and Tableau editions run on annual contracts. If you're leaving Tableau for something other than Power BI, read our Tableau alternatives guide; if Power BI is the one you're replacing, see Power BI alternatives.
At Martechdevs, we build the warehouse models and the first dashboards on either tool, so a later switch means rebuilding charts and keeping the numbers. Compare the same audience across five tools in our BI tool price comparison, look at a lighter option in Data Studio vs Power BI, and plan the reports themselves with our dashboard examples and templates.
Power BI vs Tableau pilot checklist
- Pick one real report that people use every week.
- List its builders, editors and readers by name.
- Price both tools for that list at list price.
- Build the report in both tools from the same warehouse tables.
- Check every total against the finance or CRM figure.
- Test authoring on the laptops your builders use, Mac or Windows.
- Ask five readers to find one answer in each version.
- Note the renewal date of any tool you'd retire.
Use the marketing data audit skill to examine the shared definitions, source totals and access evidence behind the pilot.
Keep reading
Browse all Data Warehouse guides
 Data Warehouse
Power BI Pricing: Pro, Premium Per User and Fabric Licensing
Compare Power BI Pro at $14 and PPU at $24, annual team costs, F64 viewer rules, Fabric capacity and the licence mistakes that increase your bill.
Jafrin Akter AloLast updated 11 min read
 Data Warehouse
Power BI Alternatives and Competitors: Prices and Best Fit
Tableau for visual analysts, Data Studio for Google marketing teams, Metabase for startups with a warehouse. Compare 7 Power BI alternatives by price and fit.
Jafrin Akter AloLast updated 12 min read
 Data Warehouse
Tableau Alternatives: Compare the Work Your Team Must Rebuild
Compare Power BI, Looker, Sigma, Qlik and ThoughtSpot with practical migration tests, calculation traps and a full transition-cost example.
Jafrin Akter AloLast updated 10 min read
Data warehouse & CDP
See the implementation scope, deliverables and acceptance checks.
Questions people ask
Is Power BI cheaper than Tableau?
Yes, at list price Power BI costs less at every team size in our worked examples. Pro is $14 per user a month, while Tableau Standard charges $75 per Creator, $42 per Explorer and $15 per Viewer, all billed annually. Our 25-person example with two Creators, five Explorers and eighteen Viewers costs $630 on Tableau against $350 on Pro. Tableau's Viewer Blocks are quoted, so large audiences should ask for that price.
Does Power BI Desktop run on a Mac?
No. Power BI Desktop needs Windows 10 or Windows Server 2016 or later. Mac users can build and edit reports in the Power BI service in a browser, or run Desktop on Windows 365 or Azure Virtual Desktop, which Microsoft supports. Tableau Desktop installs on both Windows and Mac, with native Apple Silicon support since its 2024.2 release.
Do Tableau viewers need a paid license?
Yes. In the role-based model each viewer needs a Viewer license, $15 a month on Standard, billed annually. From July 2026 Tableau also sells capacity-based Viewer Blocks, which cover unlimited viewer accounts within a usage limit at a quoted price. Desktop Free Edition is free for one person's private analysis, but it can't publish or share workbooks, so it doesn't replace viewer licenses.
Do Power BI and Tableau have MCP servers for AI assistants?
Yes, both do. Microsoft documents a Power BI Authoring MCP server for building semantic models, available locally and as a hosted endpoint, and points question answering to Fabric IQ. Tableau MCP is Tableau's official open-source server, hosted for Tableau Cloud and usable with any Cloud or Server edition, though some tools need Tableau+ or Data Management.
Is Tableau part of Salesforce?
Yes. Salesforce owns Tableau, but Tableau Cloud and Tableau Next are separate products with different deployment and licence arrangements. Salesforce lists Tableau Next platform inclusion in eligible Core, Advanced and Max packages; that does not by itself supply the Tableau Cloud roles priced in this comparison. Confirm the exact bundled and additional products on the order. Product boundaries.
Sources
- Microsoft Power BI pricing
- Salesforce: Tableau prices
- Tableau Cloud pricing
- Salesforce analytics pricing
- Azure retail prices for Microsoft Fabric in East US
- Tableau Cloud license models
- Microsoft Fabric licenses and capacity
- Power BI Desktop requirements
- Create a report in the Power BI service
- Tableau Desktop install guide
- Copilot for Power BI overview
- About Tableau Cloud+
- Power BI MCP servers overview
- Tableau MCP documentation
- Power BI Premium to Microsoft Fabric migration FAQ
- Tableau Server license models
- Microsoft for Startups
- Tableau Desktop edition comparison
- Salesforce completes acquisition of Tableau
- Getting started with the Tableau+ Bundle
- Buy or remove licenses for a Microsoft business subscription
- Fabric reservation coverage and terms

Written by
Jafrin Akter AloData Engineer and Co-founder at Martechdevs and Growth and Analytics Partners
Jafrin writes practical guides to marketing technology, customer data, analytics and AI workflows. Martechdevs is a Growth and Analytics Partners company.