
Power BI Alternatives and Competitors: Prices and Best Fit
Power BI alternatives fit different buyers: Tableau suits analysts who explore data visually, Data Studio suits marketing teams on Google Ads and GA4, and Metabase suits startups with a warehouse and SQL skills. AWS teams with many light readers should price Quick Sight at $3 per reader a month. Keep Power BI when its required model, refresh and access design fits the licences your team already owns.
On this page
Power BI alternatives and competitors at a glance
US list prices in USD, per user per month unless marked, with the billing period on each row.
| Tool | Starting price | Best fit | Main tradeoff |
|---|---|---|---|
| Tableau | Viewer $15, Explorer $42, Creator $75, billed annually | Analysts who explore data visually, Mac users, Salesforce shops | A Creator costs over five times a Power BI Pro seat |
| Data Studio | Free; Pro $9 per user per project | Marketing teams on Google Ads, GA4 and BigQuery | Built for self-service reports, with little shared modeling |
| Looker | Quote only | Governed metrics defined in code on Google Cloud | Needs a developer to write and own the model |
| Qlik Cloud Analytics | $300 a month for 10 users, billed annually | Many users on a modest data volume | Priced by data volume; Starter is fixed at 10 GB |
| AWS Quick Sight | Reader $3, Author $24, monthly | AWS companies with many light readers | Pro and Q&A features add a $250 monthly account fee |
| Metabase | Open source free; Starter $100 a month for 5 users | Startups with a warehouse and SQL skills | Running the free edition is your job |
| Sigma | Quote only | Spreadsheet-minded teams on Snowflake, Databricks or BigQuery | Needs a cloud warehouse and has no public price |
For comparison, Power BI Pro is $14 per user a month and Premium Per User $24, both paid yearly, on Microsoft's Power BI pricing page. Each tool name links to the page its price comes from.
Reasons to replace Power BI, and reasons to stay
A Power BI alternative makes sense when one of these limits bites:
- Mac-based report builders: Power BI Desktop needs Windows 10 or Windows Server 2016 or later, per Microsoft's Desktop requirements.
- Premium Per User spreading: Microsoft's PPU guide says everyone who opens content in a PPU workspace needs PPU, so one large model can raise the bill for a whole audience.
- Capacity bills: free viewing only starts at Fabric F64, per the Fabric licenses guide, and an F64 costs $5,002.67 a month on a one-year reservation in East US, from Microsoft's retail price list.
- Data that lives elsewhere: marketing data in Google Ads, GA4 and BigQuery, or a company that runs on AWS, often fits a tool from the same ecosystem.
A Fabric reservation is a commitment for matching capacity use. It excludes storage and networking, and its expiry can return continuing workloads to pay-as-you-go rates. Include those costs and the renewal decision in the model. Fabric reservation coverage.
The reasons to stay are just as concrete. One $14 Pro seat lets a person build, share and read reports, and Microsoft 365 E5 already includes Pro. If the pain is a slow model or a messy refresh, fix the model first, because the same problems move with it into any new tool. Our Power BI pricing and licensing guide shows when Pro, PPU or capacity makes sense, and our data warehouse and reporting service fixes the models and pipelines behind reports on whichever tool you keep.
Power BI alternatives compared
Tableau for visual analysis and Mac users
- Best for: analyst teams that explore data visually, and businesses that run on Salesforce.
- Pros: Desktop installs on Windows or Mac per Tableau's install guide, Creator includes Prep Builder, and Explorer lets people edit in the browser for $42.
- Cons: Creator, Explorer and Viewer cost $75, $42 and $15 a month billed annually on Salesforce's Tableau page, and Tableau's license guide says editions can't be mixed, so an Enterprise requirement applies to the users in that deployment.
- Free plan and startup offer: Desktop Free Edition covers one person's private analysis but can't publish or share, per Tableau's edition comparison. There's a Tableau Cloud trial and no published startup price.
- Choose it if: two or more people spend their day exploring data, or Salesforce data drives the reports.
- Skip it if: most of your audience only reads fixed dashboards; the 25-person example below costs $555 a month on Tableau against $350 on Power BI.
Our Power BI vs Tableau guide compares the two in detail, and the Tableau alternatives guide covers the reverse move.
Data Studio for Google marketing data
- Best for: marketing teams reporting on Google Ads, GA4, Search Console and BigQuery. Google renamed Looker Studio back to Data Studio on 11 April 2026.
- Pros: Data Studio is free, has Google's own connectors for Google Analytics, Google Ads, Search Console, BigQuery and Sheets, and report viewers don't need a Pro license, per the Pro subscription guide.
- Cons: Google's own comparison with Looker places Data Studio at self-service and one-off reports, so shared metric definitions are better kept in BigQuery or Looker.
- Free plan and startup offer: the base product is free; Data Studio Pro is $9 per user per project a month, with a 30-day free trial per the About Pro guide.
- Choose it if: your data lives in Google products and most people only view reports.
- Skip it if: you need the same governed metrics reused across many reports.
Read Data Studio vs Power BI for the head-to-head and Data Studio alternatives if you're weighing it against others. Our Looker Studio dashboards work builds these reports at a fixed price.
Looker for governed metrics on Google Cloud
- Best for: companies on Google Cloud that want every metric defined once, in code.
- Pros: LookML describes dimensions, aggregates, calculations and relationships once for every report, and every edition includes 10 standard users and 2 developer users, per Google's edition guide.
- Cons: pricing is quote only on Looker's pricing page, and the Standard edition caps users at 50 and query API calls at 1,000 a month.
- Free plan and startup offer: no free edition is listed; Data Studio is Google's free tool.
- Choose it if: disputes over metric definitions are the main problem and someone will own the model.
- Skip it if: nobody on the team writes code, since the model is the product.
Qlik Cloud Analytics for many users on modest data
- Best for: companies with many report users and a modest amount of data.
- Pros: Qlik's pricing lists Standard at $825 a month for 25 GB of data with no cost for additional users, and Starter at $300 a month for 10 users.
- Cons: the bill follows data for analysis, Starter's 10 GB is fixed with no extra capacity for sale, every plan is billed annually, and Enterprise is quote only.
- Free plan and startup offer: a free trial, with no length stated on the pricing page.
- Choose it if: your user count is high and your analysis data stays near 25 GB.
- Skip it if: data volume grows faster than headcount, because capacity is the bill.
AWS Quick Sight for AWS companies with many readers
- Best for: companies whose data already sits in AWS, with many occasional readers.
- Pros: AWS Quick Sight pricing lists Readers at $3 and Authors at $24 per user a month, plus reader session capacity at $250 for 500 sessions a month.
- Cons: Author Pro at $40 and Reader Pro at $20 add AI features, and any Pro user or Q&A switches on a $250 monthly account fee.
- Free plan and startup offer: a free start with no stated trial length; the page says authors get promotional access to Quick Enterprise until 31 December 2026 in supported regions.
- Choose it if: you're on AWS and readers outnumber authors many times over.
- Skip it if: your data and logins live outside AWS.
Metabase for startups with a warehouse
- Best for: startups with a warehouse and people who can write SQL.
- Pros: Metabase's pricing lists a free open-source edition with unlimited users, and Starter at $100 a month, or $1,080 a year, for 5 users plus $6 per extra user a month, or $65 a year on annual billing.
- Cons: the free edition is software you run yourself, Pro jumps to $575 a month for 10 users, and Enterprise starts at $20,000 a year.
- Free plan and startup offer: open source is free, and paid plans come with a 14-day trial.
- Choose it if: you want low cost and a team that's comfortable with SQL.
- Skip it if: the proposed edition fails the required access or governance tests. Metabase Pro adds row- and column-level permissions; price that edition before comparing it with a governed deployment.
Our Metabase alternatives guide covers the tools teams move to when they outgrow it.
Sigma for spreadsheet users on a cloud warehouse
- Best for: finance and operations teams who think in spreadsheets, with data in Snowflake, Databricks or BigQuery.
- Pros: Sigma works on live warehouse data through a connected spreadsheet, and its input tables save edits back to the warehouse.
- Cons: the pricing page publishes no prices, and live queries and refreshes consume warehouse resources; include actual query and caching behavior in the operating budget.
- Free plan and startup offer: a free trial, with no length stated.
- Choose it if: the warehouse is already your source of truth and people want spreadsheets on top of it.
- Skip it if: you don't have a cloud warehouse yet.
Power BI alternatives cost for a 25-person team
This worked example assumes the same 25 people for each tool: three report builders and twenty-two readers. Prices are US list monthly equivalents before tax. Tableau, Power BI, Qlik and the displayed Metabase calculation use annual billing; Quick Sight uses its monthly per-user rates. Each tool must still pass the same feature and access tests.
| Tool | License mix | Monthly cost |
|---|---|---|
| Data Studio | Free, or Pro for 3 builders in one project | $0 to $27 |
| AWS Quick Sight | 3 Authors, 22 Readers | $138 |
| Metabase Starter | 5 included users, 20 extra | $198.33 |
| Power BI Pro | 25 Pro seats | $350 |
| Tableau Standard | 3 Creators, 22 Viewers | $555 |
| Qlik Cloud Analytics Standard | Up to 25 GB, no charge for users | $825 |
The arithmetic: Quick Sight is 3 × $24 + 22 × $3 = $138; Metabase is ($1,080 + 20 × $65) ÷ 12 = $198.33; Tableau is 3 × $75 + 22 × $15 = $555. The Qlik row uses Standard because its $825 price includes the stated 25GB and additional users. Qlik also sells extra Starter users, so a Starter-plus-fifteen-users quote may fit this audience if the workload stays within Starter’s fixed 10GB. Compare that quote before treating Standard as the cheapest option. Looker and Sigma need a quote. These amounts exclude warehouse, storage and connector costs. Live queries and refreshes can add compute charges; cached results and extract-based reporting change that pattern. Model the actual refresh schedule and peak workload rather than multiplying every dashboard view by a presumed warehouse query.
Power BI alternative by scenario
The right Power BI alternative depends on where your data lives and who reads the reports. A weaker fit is marked with its reason.
| Company size or model | Best fit | Runner-up | Reason |
|---|---|---|---|
| 5 to 20 person marketing team on Google Ads and GA4 | Data Studio | Metabase | Free with Google connectors; Metabase is a weaker fit without a warehouse |
| Seed-stage SaaS with a warehouse and SQL skills | Metabase | Data Studio | Open source is free; Data Studio is weaker outside Google sources |
| Analyst team on Macs exploring data visually | Tableau | Qlik Cloud Analytics | Tableau Desktop runs on Mac; Qlik's price follows data volume |
| AWS company with many light readers | AWS Quick Sight | Power BI with a sized capacity or Pro seats | Compare the $3 Reader model with the complete Power BI configuration; 358 is not a crossover against Quick Sight |
| Google Cloud company that wants governed metrics | Looker | Sigma | LookML defines each metric once; both need a quote |
| Finance team working in spreadsheets on Snowflake | Sigma | Tableau | Spreadsheet interface on live warehouse data |
| Microsoft 365 company with mostly report readers | Stay on Power BI Pro | Data Studio | $14 covers authors and readers, and E5 already includes Pro |
For a Microsoft 365 team whose report and access requirements fit its existing Power BI licences, we'd fix the model before changing platforms. We'd trial Data Studio for Google marketing reporting, Metabase for a SQL-backed workflow and Tableau for required native Mac authoring or visual-analysis tasks. Keep the candidate only after its report, permission and cost tests pass.
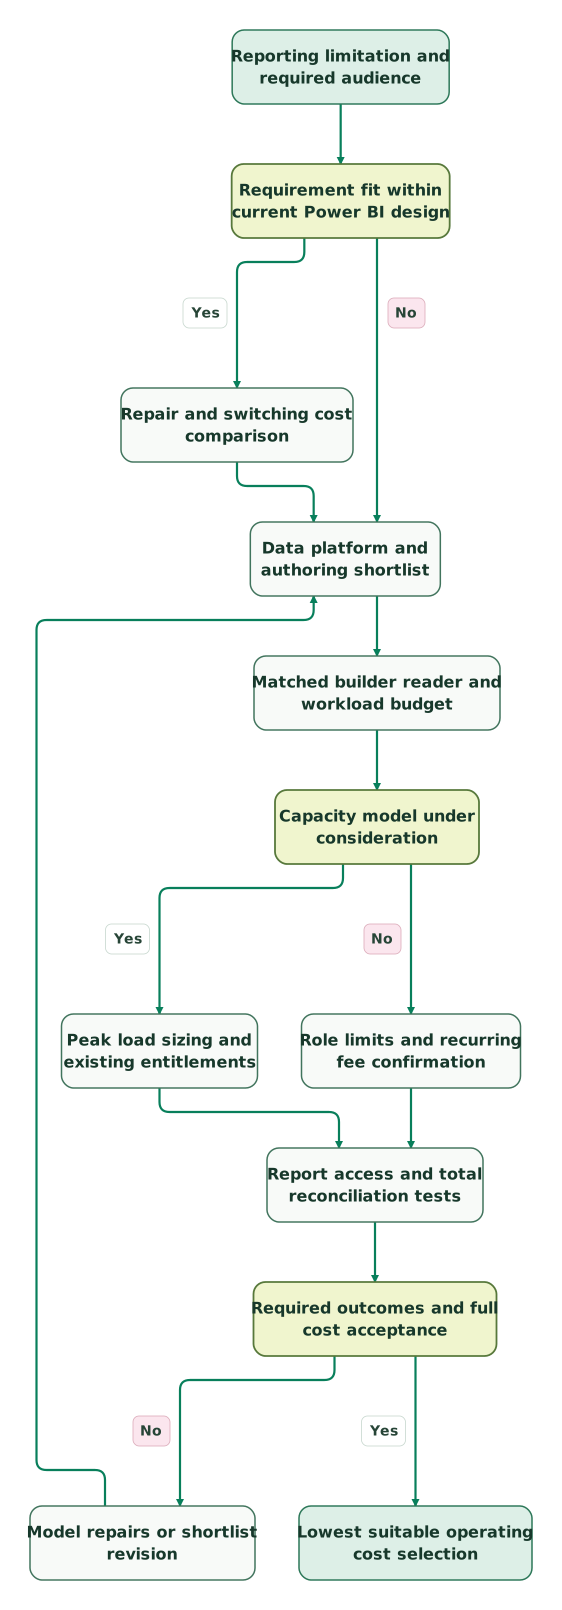
Read diagram as text
- Reporting limitation and required audience to Requirement fit within current Power BI design.
- Requirement fit within current Power BI design to Repair and switching cost comparison: Yes.
- Requirement fit within current Power BI design to Data platform and authoring shortlist: No.
- Repair and switching cost comparison to Data platform and authoring shortlist.
- Data platform and authoring shortlist to Matched builder reader and workload budget.
- Matched builder reader and workload budget to Capacity model under consideration.
- Capacity model under consideration to Peak load sizing and existing entitlements: Yes.
- Capacity model under consideration to Role limits and recurring fee confirmation: No.
- Peak load sizing and existing entitlements to Report access and total reconciliation tests.
- Role limits and recurring fee confirmation to Report access and total reconciliation tests.
- Report access and total reconciliation tests to Required outcomes and full cost acceptance.
- Required outcomes and full cost acceptance to Model repairs or shortlist revision: No.
- Model repairs or shortlist revision to Data platform and authoring shortlist.
- Required outcomes and full cost acceptance to Lowest suitable operating cost selection: Yes
Switching from Power BI
Moving off Power BI means rebuilding reports. Re-express DAX measures in the target model, rebuild report pages and test row-level security under the intended user roles. Check filter context and relationship behavior alongside the arithmetic, because matching formulas can still produce different totals. Scheduled refreshes and email subscriptions need new owners too.
Moving shared business definitions into the data model can reduce repeated migration work. When revenue, pipeline and churn are defined once in warehouse tables, any of these tools reads the same numbers, and the next switch costs less. We'd then run both tools side by side for one reporting cycle and check every total against finance before turning Power BI off.
Plan the cut date around the renewal. Microsoft lets Customer Agreement accounts remove licenses only within seven days of buying or renewing, per its license management guide, so a reduction outside that window waits for the next renewal.
At Martechdevs, we build the warehouse models and dashboards on whichever tool you pick, so the numbers survive the move. To compare the same audience across tools, use our BI tool price comparison, and to plan the reports themselves, start from our dashboard examples and templates.
Power BI replacement checklist
- Write down the problem the new tool must solve.
- List every report, its owner and its readers.
- Mark the reports nobody opened in 90 days and retire them.
- Move key metric definitions into warehouse tables.
- Price two alternatives for the same list of people.
- Rebuild your busiest report in both and compare every total.
- Test access rules with a real reader account.
- Set the Power BI cut date inside the renewal window.
Use the marketing data audit skill to document source totals, shared metrics and access tests before accepting the replacement.
Keep reading
Browse all Data Warehouse guides
 Data Warehouse
Power BI vs Tableau: Prices, Licenses and Best Fit by Team Size
Compare Power BI and Tableau costs for the same reporting roles, Mac authoring, capacity, AI and deployment needs, with worked budgets and a pilot checklist.
Jafrin Akter AloLast updated 11 min read
 Data Warehouse
Power BI Pricing: Pro, Premium Per User and Fabric Licensing
Compare Power BI Pro at $14 and PPU at $24, annual team costs, F64 viewer rules, Fabric capacity and the licence mistakes that increase your bill.
Jafrin Akter AloLast updated 11 min read
 Data Warehouse
Tableau Alternatives: Compare the Work Your Team Must Rebuild
Compare Power BI, Looker, Sigma, Qlik and ThoughtSpot with practical migration tests, calculation traps and a full transition-cost example.
Jafrin Akter AloLast updated 10 min read
Data warehouse & CDP
See the implementation scope, deliverables and acceptance checks.
Questions people ask
Is there a free alternative to Power BI?
Yes. Data Studio is free for building and sharing reports, and its viewers never need a paid license. Metabase has a free open-source edition with unlimited users, and Apache Superset is open source under the Apache License. The open-source tools are free to license but you run the servers; Preset, a managed Superset service, is free for up to 5 users.
Who are Power BI's main competitors?
Power BI's main competitors are Tableau from Salesforce, Looker and Data Studio from Google, AWS Quick Sight and Qlik Cloud Analytics. Metabase, Sigma and Apache Superset compete for teams that already run a cloud warehouse. Each sits closest to its own ecosystem, so the best match usually follows where your data and logins already live.
What is the cheapest Power BI alternative for report viewers?
Data Studio is the cheapest for viewers, since people who only view reports don't need a Pro license. Among paid tools, AWS Quick Sight charges $3 per reader a month against $14 for a Power BI Pro seat. The roughly 358-reader F64 crossover compares capacity with additional $14 Pro seats, not Quick Sight’s $3 Readers. Validate capacity and existing licences before using it.
Which Power BI alternative works best on a Mac?
Tableau is the strongest Mac option, because Tableau Desktop installs on Mac and runs natively on Apple Silicon since its 2024.2 release. Data Studio, Looker, Sigma, Quick Sight and Metabase run in a web browser, so they work on any laptop. Power BI Desktop needs Windows, so Mac users either author in the browser or use a remote Windows desktop.
Should we leave Power BI because of Fabric capacity costs?
Capacity cost alone is a reason to investigate the workload and licensing. At the stated East US reservation rate, about 358 additional $14 Pro viewers reach F64’s capacity price, with author seats held constant. Existing E5 entitlements, larger capacity needs and non-Power-BI Fabric workloads change that comparison. Diagnose model size, refresh load and access requirements before choosing another platform.
Sources
- Microsoft Power BI pricing
- Power BI Desktop requirements
- Power BI Premium Per User
- Microsoft Fabric licenses and capacity
- Azure retail prices for Microsoft Fabric in East US
- Tableau Desktop install guide
- Salesforce: Tableau prices
- Tableau Cloud license models
- Tableau Desktop edition comparison
- Google Cloud: Looker Studio is Data Studio
- Data Studio available connectors
- Data Studio Pro subscription overview
- Compare Looker and Data Studio
- Data Studio pricing
- About Data Studio Pro
- What is LookML
- Looker editions and entitlements
- Looker pricing
- Qlik Cloud Analytics pricing
- AWS Quick Sight pricing
- Metabase pricing
- Sigma
- Sigma pricing
- Buy or remove licenses for a Microsoft business subscription
- Apache Superset
- Preset
- Preset pricing
- Fabric reservation coverage and terms

Written by
Jafrin Akter AloData Engineer and Co-founder at Martechdevs and Growth and Analytics Partners
Jafrin writes practical guides to marketing technology, customer data, analytics and AI workflows. Martechdevs is a Growth and Analytics Partners company.