
Tableau Alternatives: Compare the Work Your Team Must Rebuild
Data Engineer and Co-founder, martechdevs
Last updated 10 min read
The right Tableau alternative depends on what you need to preserve: visual exploration, governed metrics, spreadsheet planning, associative discovery or analytics inside your product. Shortlist around that requirement, then migrate a difficult workbook as a trial. A cheaper license is useful only if the replacement preserves the decisions, permissions and calculations your team relies on.
Last updated: 9 September 2026.
A dashboard inventory is an incomplete migration plan. The important dependencies often sit inside calculated fields, extracts, scheduled deliveries, workbook actions and the habits of the people using them. Rebuilding the visible charts can leave those dependencies behind.
This guide compares five credible directions and gives you a way to test them. The recommendations are based on documented capabilities and the decision each product can support, not a hands-on performance ranking. If your main concern is the renewal bill, calculate your actual Tableau license and operating costs before approving a replacement project.
What problem would justify leaving Tableau?
Write a one-sentence reason that can be measured. Examples include: regional managers cannot investigate exceptions without an analyst; finance exports every report to add forecasts; or maintaining the current deployment consumes too much engineering time.
“Modernize analytics” does not establish a useful acceptance test. “Reduce the time to explain a regional revenue variance from two days to one working session” does.
Separate platform limitations from problems in the data beneath it. A duplicated customer key, undefined revenue measure or unreliable source sync will follow you into the next tool. Our warehouse and reporting work starts with those definitions because changing visualization software cannot settle a disagreement about what a number means.
Before shortlisting, identify the workflows worth retaining. Review recent usage with the business owner, then classify each workbook as actively used, required only at a specific reporting event, replaceable with a simpler delivery, or ready to retire. Do not treat a quarterly board report as unused because nobody opened it last week.
Which alternatives deserve a trial?
Power BI for a Microsoft-centered reporting environment
Consider Power BI when your organization wants a common reporting environment alongside its existing Microsoft administration and analytics work. The practical question is whether report authors can maintain the required semantic models and whether recipients have the right access arrangement.
Microsoft distinguishes per-user Pro and Premium Per User licenses from capacity. A PPU workspace generally requires PPU for its consumers; it is not equivalent to buying capacity that supports free viewers. Eligible Fabric F64 or higher capacity can support sharing to free users under the documented conditions. Model this distribution design before counting licenses. Microsoft's licensing guide explains the distinction.
For the trial, reproduce a workbook with a business-critical calculation and a restricted regional view. Ask an analyst to modify it, then ask an ordinary viewer to access the published result. Include exports and mobile use if those are part of the real workflow. An author account is a poor substitute for testing a recipient's experience.
Looker for shared business definitions maintained in code
Consider Looker when reusable definitions and consistent exploration matter more than preserving the exact layout of existing workbooks. LookML describes dimensions, measures and relationships that Looker uses to generate SQL against the database. Maintaining that model is a real responsibility, not an automatic consequence of buying the platform. Google's LookML introduction describes the model and development approach.
Your trial should change a definition, not merely display one. Update the treatment of refunds in net revenue, identify the affected reports, review the change and explain how it reaches production. This exposes whether your team has the ownership and skills to keep shared definitions reliable.
Looker and Data Studio are separate products. Do not use the cost or capabilities of one to estimate the other. If lightweight report creation is your actual requirement, the Data Studio alternatives comparison is a more appropriate starting point.
Sigma for analysis that includes planning inputs
Consider Sigma when readers regularly export reports to enter targets, forecasts or operational decisions in a spreadsheet. Its input tables support structured entry alongside existing data without overwriting the source records. The documentation also describes permissions, validation and edit history. Sigma's input table guide explains these mechanics.
Make the trial a complete planning cycle: load actuals, enter a forecast, restrict who can change it and retrieve the approved output. For linked input tables, stable unique keys matter; a row number that changes when data is sorted is a poor identifier.
The question is not whether the interface looks familiar. It is whether your forecast remains attached to the correct account after a source update. Include a renamed account, a new account and a changed territory assignment in the test data. Ask the future maintainer to explain the result without assistance from the person who built the demo.
Qlik for exploring associations and exceptions
Consider Qlik when investigation involves following relationships across many dimensions and noticing what falls outside the current selection. Qlik's associative selection model distinguishes selected, possible, alternative and excluded values. That interaction can support a different investigative habit from moving through a fixed sequence of dashboard pages. Qlik documents the selection states.
Give users a concrete question: which product and region combinations missed their target, and which combinations disappear when a channel is selected? Watch whether the selection states help them explain the exception or simply add unfamiliar concepts.
Also normalize the commercial model. Current Qlik Cloud documentation describes Starter as user-priced with fixed data capacity, while higher editions use analyzed-data capacity. A viewer-seat comparison alone is therefore incomplete. Qlik's subscription guide provides the current structure; request a quote using your retained data and refresh requirements.
ThoughtSpot for search and embedded exploration
Consider ThoughtSpot when the product requirement is to let users explore through search or to put interactive analytics inside an application. Its embedding framework supports components including search, visualizations and Liveboards. The Visual Embed SDK provides controls beyond a basic iframe. The embedding documentation describes the supported methods.
Test a question with an ambiguous business term, a user restricted to one customer account and a session that expires. These are more informative than a prepared question against a demonstration dataset.
An embedded component does not remove your application's responsibilities. Define how authentication is established, how the allowed account is determined, what happens when permissions change and who receives errors. Evaluate the entire customer interaction, including the route back to the product's operational screen.
What must a Tableau migration preserve?
Create an inventory at three levels: business decisions, workbook behavior and upstream dependencies. One workbook can support several decisions, and several workbooks can repeat the same definition.
For each retained workflow, record:
- The decision owner and the action they take from the report.
- Source tables, extract schedules and the acceptable age of data.
- Calculated fields, level-of-detail expressions and table calculations.
- Filter behavior, parameters, drill paths and actions.
- Access rules, subscriptions, downloads and embedded uses.
- A small dataset with expected answers for important cases.
The expected answers are your migration contract. Screenshots help with layout review, but they cannot prove that a filtered denominator or restricted export behaves correctly.
A calculation can look identical and mean something different
Tableau evaluates FIXED level-of-detail expressions before ordinary dimension filters. A filter can therefore change a numerator while leaving a FIXED denominator unchanged. Context filters change this relationship. Tableau's filter-order documentation is essential when translating these calculations.
Consider this illustrative dataset: East has USD400 of revenue and West has USD600. East's share of company revenue is 400 / 1,000 = 40%. If a replacement report filters to East first and recomputes both numerator and denominator from the filtered rows, it displays 400 / 400 = 100%.
Both calculations are mathematically valid. They answer different questions. Decide whether the report should show share of the company or share of the visible selection, then test that choice explicitly. Do not approve the migration because the unfiltered grand total matches.
Add a missing region, a refund and a zero-revenue period to the same fixture. The goal is to reveal semantic differences while they are cheap to correct. A metric contract makes the intended behavior understandable to both analysts and decision makers.
How should you run the comparison?
Limit the initial trial to two candidates that fit the actual problem. More tools create more demonstration work without necessarily improving the decision.
Give each candidate the same representative workload. Include one everyday report, one difficult calculation, one access-sensitive workflow and one recurring delivery. For a planning use case, replace the delivery exercise with an input-and-approval cycle. Use realistic data volumes and the concurrency your team expects during a busy reporting period.
Record evidence separately from opinion. “The chart felt faster” is an observation; measured load time across a defined workload is evidence. “Users preferred the interface” needs the number and type of users, the tasks they performed and whether they completed them correctly.
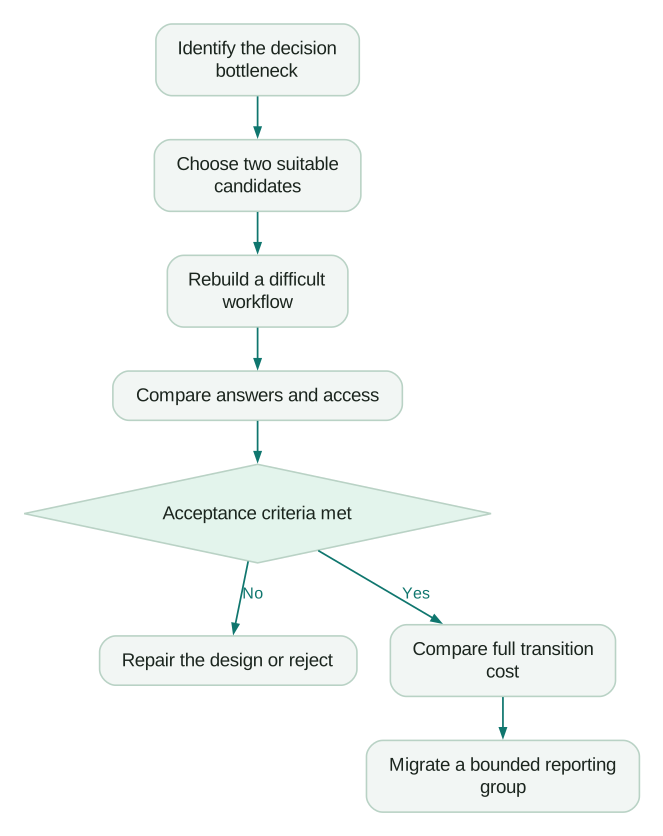
Do not average away a failed access requirement with a high visual-design score. Establish a few non-negotiable conditions first: correct calculations, required access isolation, acceptable freshness and a maintainable operating process. Compare convenience and presentation after those pass.
When does a cheaper license fail to produce a saving?
Use a transition calculation with explicit assumptions. In this fictional example, a replacement reduces annual software cost by USD4,800. Rebuilding and validating the retained work requires 100 hours at an internal planning rate of USD75, or USD7,500. Parallel operation costs another USD1,200, making the transition USD8,700.
If the new environment adds two hours of maintenance each month, annual extra labor is USD1,800. Net recurring savings are USD3,000 a year, so simple payback is 8,700 / 3,000 = 2.9 years. This ignores financing and tax effects and is not a vendor quote.
A three-year payback may still be acceptable if the replacement enables a valuable workflow. It is a weak argument if the sole reason for moving was an urgent reduction in spending. Include the cost of a smaller repair option: retiring unused workbooks, correcting roles or moving repeated calculations upstream.
Also distinguish recoverable time from cash savings. Giving an analyst two hours back does not automatically reduce payroll. Describe whether that time will remove contractor spending, avoid a planned hire or simply create room for more useful analysis.
What should be true before switching users?
Move one coherent reporting group first. Keep a named rollback owner and preserve the old source definitions for the agreed transition period. Avoid editing both platforms independently without a record of which definition is authoritative.
Checklist
- Business owners have approved the reports that will be retained or retired.
- Calculation fixtures match for filters, refunds, empty periods and totals.
- Ordinary viewers and restricted users have tested access and exports.
- Refreshes, scheduled deliveries and failure notifications have named owners.
- The operating-cost estimate includes parallel running and maintenance.
- Users can complete their real tasks without the migration team guiding every step.
- The old environment has a retirement date tied to successful acceptance.
A migration is ready when the new system can support a business decision reliably and the team can maintain it. Reproducing every decorative detail of the old dashboard is rarely the best use of that effort.
Questions people ask
What is the best Tableau alternative?
There is no universal winner. Choose around the work you need to improve: Microsoft-centered reporting, shared definitions, planning inputs, associative investigation or embedded exploration. Validate the candidate with one difficult workflow before committing to a wider migration.
Can we automatically convert every Tableau workbook?
Do not budget on that assumption. Inventory calculations, filters, actions, permissions and deliveries, then establish what can be translated and what needs redesign. Even if a conversion tool produces a report, expected-answer tests are still necessary.
Should we replace Tableau because another product has AI?
AI availability is a poor standalone migration criterion. Test whether users get correct answers to the questions they actually ask, whether the system respects permissions and whether the team can trace the answer to an agreed definition. Compare that benefit with the cost of changing the existing environment.
How long should both reporting tools run together?
Choose a period that covers the important reporting events and edge cases, rather than an arbitrary number of days. A daily operations report and a quarterly financial pack need different acceptance windows. Give parallel operation an owner and exit criteria so it does not become permanent double maintenance.
Is keeping Tableau a valid outcome of the comparison?
Yes. If the trial shows that the main problem is source quality, unused licenses or duplicated logic, a targeted repair may create more value than a platform change. Document the evidence and the improvement you will make, rather than treating migration itself as the goal.
Sources
- Microsoft: Power BI service features by license type. Accessed 9 September 2026.
- Google Cloud: Introduction to LookML. Accessed 9 September 2026.
- Sigma: Input tables overview. Accessed 9 September 2026.
- Qlik: The associative selection model. Accessed 9 September 2026.
- Qlik: Cloud Analytics subscription options. Accessed 9 September 2026.
- ThoughtSpot: Embedding overview. Accessed 9 September 2026.
- Tableau: Filters and level-of-detail expressions. Accessed 9 September 2026.
Written by
Jafrin Akter AloData Engineer and Co-founder, martechdevs
Jafrin Akter Alo is a data engineer and co-founder of martechdevs, where the team has delivered 74+ martech, data and growth stack implementations.