
Looker vs Tableau: Modeling, Visual Analysis and Ownership Cost
Pick Looker when a maintained LookML model and warehouse-centered exploration fit your team's reporting process. Pick Tableau when its visual-analysis workflow and deployment options help analysts answer the required questions. Compare shared definitions, analyst changes, permissions, refresh behavior and the complete audience cost using a representative business task.
On this page
Looker and Tableau compared
USD US list prices below use annual billing; Looker is quote-based and Tableau figures are Standard role licences.
| Decision | Looker | Tableau |
|---|---|---|
| Subscription structure | Quoted platform plus user entitlements | Creator $75, Explorer $42 and Viewer $15 per user/month |
| Shared definitions | LookML models generate queries for exploration | Data-source models, relationships and reusable published content |
| Analyst workflow | Exploration through maintained fields and relationships | Visual exploration and workbook authoring under the assigned role |
| Data access | Database queries with configured caching and derived tables | Live connections or extracts with an appropriate refresh design |
| Deployment scope | Named Looker offering and platform edition | Tableau Cloud, Server or a separately scoped Tableau Next purchase |
Sources: Looker pricing, Tableau role prices, LookML, Tableau data models, Tableau product pricing.
This comparison focuses on Looker and the established Tableau Cloud or Server reporting workflow. Tableau Next is a distinct product, sold separately or in a bundle. Its semantic and AI capabilities should be evaluated under that product's scope rather than silently added to a Standard Tableau Cloud quote. Tableau Next.
At Martechdevs, we connect warehouse models and reporting implementations to the decisions the business needs. The BI tool must let an analyst investigate a result without losing the shared definition behind it. The trial should test both freedom to explore and the controls that keep a published number trustworthy.
Shared modeling and visual exploration
LookML lets a modeling team define dimensions, calculations and relationships that Looker turns into database queries. Business users can explore those definitions without recreating the underlying SQL each time. The value depends on whether the model contains the questions they actually need to answer. LookML overview.
Tableau data sources also have models. Its logical layer uses relationships between tables, while the physical layer contains joins and unions. Logical tables can preserve their own level of detail rather than being flattened immediately into one table. Tableau therefore needs deliberate modeling even when the analyst starts through a visual interface. Tableau model layers.
Looker selection boundaries
- Best for: a data team maintaining reusable warehouse definitions for many recurring analytical questions.
- Pros: LookML exploration and a version-controlled model can support a shared definition and release process.
- Cons: questions outside the maintained model can require development work, and platform and user charges need a complete quote.
- Free plan and startup offer: core evaluation instances last 90 days and require a new instance and import for the paid transition. Confirm trial charges and any startup concession separately. Core evaluation terms.
- Choose it if: the maintained model covers the real investigation and a named team owns subsequent definition changes.
- Skip it if: analysts cannot complete their recurring investigations through the proposed model and operating process.
These boundaries follow LookML, model deployment and Looker user entitlements.
Tableau selection boundaries
- Best for: analysts whose daily work benefits from visual investigation and maintained shared data sources.
- Pros: visual authoring, logical relationships and live or extract connections support several analysis patterns.
- Cons: workbook calculations, filter order, content publishing and refreshes still need explicit standards and owners.
- Free plan and startup offer: Desktop Free Edition supports one person's private analysis but cannot publish or share workbooks. Budget the required Cloud or Server licences separately and include only an approved startup concession. Edition comparison.
- Choose it if: analysts can reproduce the accepted result and publish it under the intended access and refresh controls.
- Skip it if: a successful chart demonstration depends on ungoverned workbook calculations or capabilities outside the quoted product.
The feature and purchasing boundaries follow Tableau data modeling, Cloud pricing and product scope.
Use one real investigation in the trial. For example, a conversion decline needs analysis by channel, campaign, landing page and customer segment. Ask the analyst to change the view, inspect a suspicious segment and explain the denominator. Then ask another analyst to reproduce the accepted result from the maintained content.
The useful output is an answer with a traceable definition and a clear next action. A longer list of chart types matters only when the business needs those forms to see a pattern accurately.
Filters, calculations and denominator control
A report can display a plausible number while answering the wrong question. Define the intended population before comparing the tools' calculations.
Consider a hypothetical campaign with $1,000 of paid spend, 20 paid conversions and 40 organic conversions. Paid cost per conversion is $50. Dividing the same spend by all 60 conversions produces $16.67, which describes a different denominator and should not be labeled paid acquisition cost.
| Calculation | Numerator | Denominator | Result |
|---|---|---|---|
| Paid cost per conversion | $1,000 paid spend | 20 paid conversions | $50.00 |
| Spend divided by all conversions | $1,000 paid spend | 60 total conversions | $16.67 |
In Tableau, filter order can affect the calculation and the population being ranked. Context filters, dimension filters and level-of-detail calculations participate in a defined order of operations. A Top N result within a selected segment needs a test that distinguishes it from the top results overall. Tableau order of operations.
For Looker, test the same issue through the model's joins, measures and query filters. Keep a fixture with known rows and expected totals, then verify that adding a dimension does not multiply the business amount. A maintained model provides a place to encode the definition; it still needs correct logic.
Document the accepted metric in the warehouse model, including its grain, time boundary, exclusions and owner. The BI implementation should expose that definition clearly instead of making each dashboard author rediscover it.
Live connections, extracts and cache behavior
Tableau extracts store data separately from the source and can be refreshed. Their design includes filters, aggregation and full or incremental refresh behavior. A refresh strategy should account for corrections and deletions as well as new records. Tableau extracts.
A live connection can keep query execution closer to the source, but it also makes source response and concurrency relevant to the user experience. An extract can improve a particular workload while creating a freshness and lifecycle responsibility. Test the mode the production report will use.
Looker has configurable result caching and persistent derived-table behavior. Datagroups can synchronize cache expiration and rebuilds with the loading process. A warehouse-centered platform does not imply that every report view queries the latest source state. Looker caching.
| Operating case | Trial evidence | Required decision |
|---|---|---|
| Source load completes late | Report freshness after the delayed load | Delivery deadline and stale-data response |
| Existing record is corrected | Corrected value reaches the report | Refresh or rebuild behavior |
| Source access expires | Visible failure and recovery path | Credential and operational owner |
| Many users open a report | Accepted response under expected concurrency | Source, extract or platform configuration |
| A model definition changes | Shared content updates without conflicting totals | Publishing and regression process |
Include warehouse queries, extract refresh work and derived-table builds in the complete budget. The BI subscription alone cannot describe the cost of serving the report.
User roles, editions and subscription cost
Tableau Standard lists Creator at $75, Explorer at $42 and Viewer at $15 per user/month, billed annually. Every deployment requires at least one Creator. Creator supports new data connections and authoring tools, while Explorer and Viewer have different capabilities. Price the jobs people perform rather than assigning the cheapest licence to everyone. Tableau role pricing, licence capabilities.
Enterprise lists Creator at $115, Explorer at $70 and Viewer at $35 per user/month, billed annually. It includes additional Data Management and administration capabilities. Cloud+ and the Tableau+ Bundle require sales pricing. Tableau Cloud does not permit arbitrary mixing of Standard and Enterprise editions within one deployment. Tableau Cloud editions.
The following worked example uses two Creators, four Explorers and fourteen Viewers, with no additional services.
| Edition | Monthly-equivalent calculation | Monthly equivalent | Annual licence amount |
|---|---|---|---|
| Tableau Standard | 2 × $75 + 4 × $42 + 14 × $15 | $528 | $6,336 |
| Tableau Enterprise | 2 × $115 + 4 × $70 + 14 × $35 | $1,000 | $12,000 |
| Difference for this role mix | $1,000 − $528 | $472 | $5,664 |
The rates are the published Cloud role rates. The difference is specific to this mix and the required edition. If a capability requires Enterprise across the deployment, adding only one Enterprise seat does not reproduce the accepted configuration.
Tableau also offers capacity-based Viewer licensing. Creators and Explorers remain licensed by user, while the purchased capacity supports Viewer consumption. Obtain that quote for a broad or variable audience rather than assuming every reader must always be priced individually. Tableau licence models.
Looker uses platform and user pricing, with Developer, Standard and Viewer roles. Google lists ten Standard users and two Developer users within its platform editions. Ask for the exact additional audience, API, embedding and feature entitlements in the proposal, and distinguish included seats from additional purchases. Looker commercial structure.
Use the Looker pricing guide and Tableau pricing guide for the detailed review. A quote should state deployment, edition, roles, commitment, support and extra consumption so finance can reproduce the total.
Security and content governance
Tableau's effective permissions combine licence level, site role and content rules. Managing groups and projects can make that structure easier to maintain than a collection of individual workbook exceptions. Test what the actual user can view, edit and download. Tableau permissions.
Row-level filtering adds another layer. Tableau's manual or dynamic user-filter methods require permissions that prevent a user from downloading or saving content and removing the filter. With the appropriate Data Management entitlement, virtual-connection data policies provide a centralized alternative. Choose the actual enforcement method before treating a filtered screenshot as a security test. Tableau RLS options.
Looker's access filters impose user-specific restrictions on an Explore, and each Explore requiring that restriction must receive it. Verify every accessible route, including a second Explore and scheduled delivery. A single correctly filtered dashboard cannot prove the entire model is restricted. Looker access filters.
For both products, include a user from the wrong department or tenant and one whose access has been removed. Record the intended result for viewing, exploring, exporting and receiving a scheduled report. These actions can expose different parts of the data.
Change management and ongoing ownership
Looker supports Git-based LookML branches and deployment practices. A modeling team can review a change before exposing it to consumers and run data tests where configured. Keep the business acceptance test alongside syntax and deployment checks. Looker development workflow.
For Tableau, distinguish an exploratory workbook from maintained published reporting. Agree which data sources and calculations authors may reuse, who promotes a report into a trusted project and who responds to refresh failures. A successful analysis should not automatically become an undocumented production dependency.
A replacement budget needs migration of the surrounding behavior: subscriptions, permissions, extracts, scheduled deliveries, embedded views and user training. Exporting the underlying tables does not move those responsibilities.
In a hypothetical planning case, a new BI configuration saves $300/month but requires $9,000 of migration and training. Simple payback is 30 months before overlapping subscriptions or added support. A better analysis workflow may still justify the change, but that benefit needs a defined owner and success measure.
Best fit by team and workload
| Situation | First candidate | Runner-up | Deciding evidence |
|---|---|---|---|
| SQL-oriented team maintaining reusable warehouse definitions | Looker | Tableau with accepted shared sources | Model coverage, change review and accepted exploration |
| Analysts needing an established visual investigation workflow | Tableau | Looker after a representative investigation | Required analysis, reproducibility and publishing controls |
| Broad occasional-reader audience | Incumbent with a complete distribution quote | The other platform with the same audience and workload | Role mix, capacity option and real consumption |
| Existing trusted Tableau sources and trained authors | Current Tableau configuration | Looker after a demonstrated unmet requirement | A measured gap before migration |
| Inconsistent business definitions across reports | Model and ownership repair first | New platform after the metric contract is accepted | Correct shared calculations before new licences |
The Looker vs Power BI guide adds Microsoft's modeling and distribution approach. The Looker vs Looker Studio guide separates Looker from Google's Data Studio reporting product, a different choice from the one covered here.
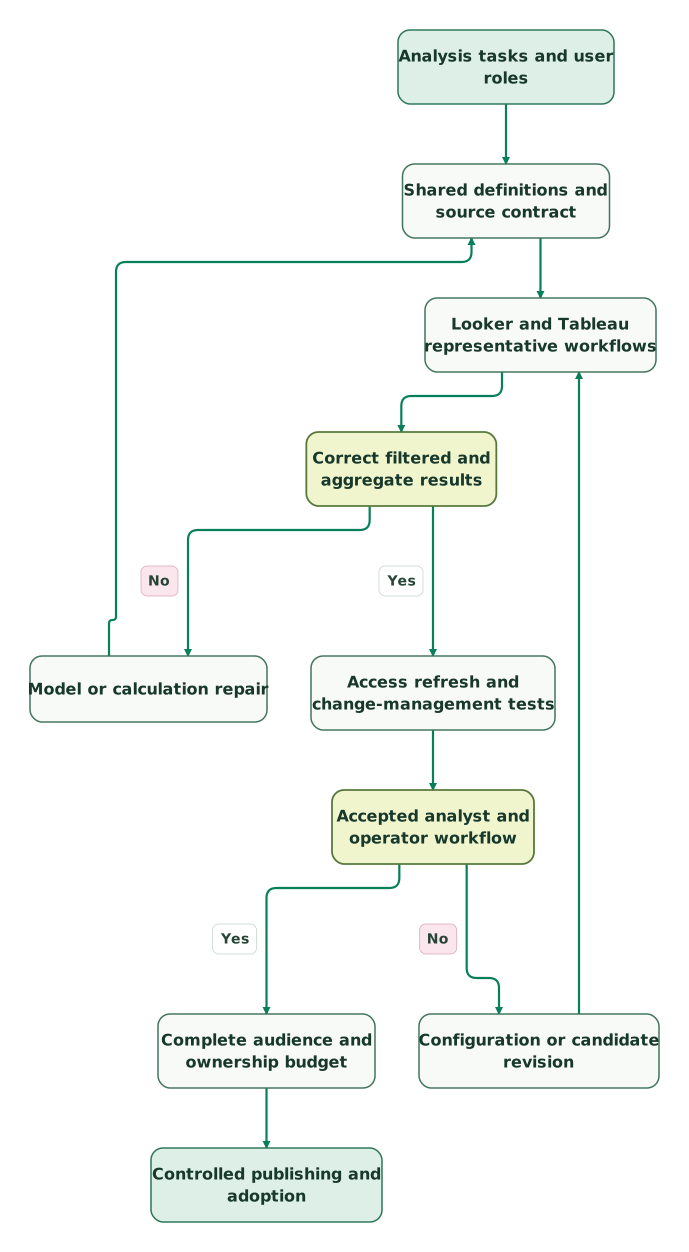
Representative BI trial
Give both candidates the same data, accepted definitions and tasks. Ask for a recurring report, an unexpected investigation and a subsequent definition change. Then test the least-privileged consumer, a failed refresh and recovery. Compare the complete cost only after those outcomes are accepted.
Read diagram as text
- Analysis tasks and user roles to Shared definitions and source contract.
- Shared definitions and source contract to Looker and Tableau representative workflows.
- Looker and Tableau representative workflows to Correct filtered and aggregate results.
- Correct filtered and aggregate results to Model or calculation repair: No.
- Model or calculation repair to Shared definitions and source contract.
- Correct filtered and aggregate results to Access refresh and change-management tests: Yes.
- Access refresh and change-management tests to Accepted analyst and operator workflow.
- Accepted analyst and operator workflow to Configuration or candidate revision: No.
- Configuration or candidate revision to Looker and Tableau representative workflows.
- Accepted analyst and operator workflow to Complete audience and ownership budget: Yes.
- Complete audience and ownership budget to Controlled publishing and adoption
Looker and Tableau checklist
- The product and deployment are named, including any Tableau Next scope.
- The same business definitions and sample cases are used in both trials.
- Filter order, aggregate denominators and drill-down results are accepted.
- Extract, cache and source behavior meet the freshness requirement.
- Creator, Explorer, Viewer and Looker roles match the required actions.
- Edition and capacity rules are reflected in the complete quote.
- Restricted users cannot bypass the chosen data-access design.
- A routine definition change and recovery task have clear owners.
- Migration value covers the full transition or a defined capability need.
Use the marketing data audit skill to organize the evidence. Our reporting implementation scope turns the accepted design into a maintained system. The $99 audit includes a written assessment and a one-hour specialist call.
Keep reading
Browse all Data Warehouse guides
 Data Warehouse
Looker vs Power BI: Semantic Models, Sharing and Complete Cost
Compare Looker and Power BI by semantic modeling, licences, access and freshness. Includes worked budgets, metric tests and a practical selection checklist.
Jafrin Akter AloLast updated 11 min read
 Data Warehouse
Looker vs Looker Studio: Data Studio, Modeling and Cost
Looker and Data Studio, formerly Looker Studio, are separate products. Compare modeling, Pro licences, credentials, ownership, connectors and complete cost.
Jafrin Akter AloLast updated 12 min read
 Data Warehouse
Power BI vs Tableau: Prices, Licenses and Best Fit by Team Size
Compare Power BI and Tableau costs for the same reporting roles, Mac authoring, capacity, AI and deployment needs, with worked budgets and a pilot checklist.
Jafrin Akter AloLast updated 11 min read
Data warehouse & CDP
See the implementation scope, deliverables and acceptance checks.
Questions people ask
Does Tableau require a flat joined table before analysis?
Tableau has logical and physical modeling layers. Logical relationships can keep tables distinct at their native level of detail, while physical joins and unions combine tables within that structure. Choose the design from the required analysis and test its totals. Flattening every source before understanding grain can create duplication and make a visual result look correct while its underlying amount is inflated. Tableau data model.
Can Tableau Standard and Enterprise seats be mixed freely in one tenant?
Tableau Cloud does not support arbitrary mixing of those editions within a single deployment. Price the edition required by the accepted capabilities for the whole relevant deployment and its role mix. A budget with one upgraded author and all other users priced at Standard can misrepresent the purchase needed. Confirm any permitted exception with the exact product configuration. Edition rules.
Does a Tableau user filter alone prove restricted data is secure?
A filter is only part of the design. Manual and dynamic user-filter approaches require permissions that prevent consumers from removing the restriction through saved or downloaded content. Evaluate the available data-policy or database-enforced alternatives where appropriate, then test the actual consumer's viewing and export paths. A filtered screenshot from the author account is insufficient evidence. RLS options.
Can Tableau Next features be assumed in a Standard Tableau Cloud quote?
Tableau Next is a distinct product that can be purchased separately or through the Tableau+ Bundle. Its capabilities and related semantic services should be mapped to the actual proposal. Keep the trial's features, deployment and licence entitlements together so an appealing demonstration does not become an assumed part of a cheaper configuration that lacks them. Tableau Next scope.
Is a visual-analysis preference enough to justify changing BI platforms?
The preference matters when it helps users complete valuable tasks, but the migration still needs correct metrics, access, freshness and maintainable operations. Test a representative investigation and a later change request, then include licences, source compute, migration and training in the budget. A platform switch is stronger when its benefit survives those practical requirements and the existing system's repair option.
Sources
- Looker platform and user pricing
- LookML modeling
- Looker caching and datagroups
- Looker access filters
- Looker version control and deployment
- Tableau role prices
- Tableau product and deployment pricing
- Tableau Cloud edition and role rates
- Tableau licence models
- Tableau Next product scope
- Tableau data-model layers
- Tableau extracts
- Tableau order of operations
- Tableau permissions
- Tableau row-level security options
- Looker core evaluation and transition
- Tableau Desktop edition comparison

Written by
Jafrin Akter AloData Engineer and Co-founder at Martechdevs and Growth and Analytics Partners
Jafrin writes practical guides to marketing technology, customer data, analytics and AI workflows. Martechdevs is a Growth and Analytics Partners company.