
GA4 Bounce Rate Looks Wrong? 5 Checks Before You Change the Page
When GA4 bounce rate changes sharply, check what made sessions count as engaged before changing the website or campaign. A duplicated page view, a different key-event definition, a timer change or a new traffic mix can move the rate without changing customer satisfaction. Reconcile the session counts, then reproduce the journeys that explain the difference.
On this page
What does bounce rate measure in GA4?
GA4 bounce rate is the share of sessions that were not engaged. Under the default definition, a session qualifies as engaged when it lasts longer than ten seconds, contains a qualifying key event, or has at least two page or screen views. Any one condition is enough. Google's engagement and bounce definitions.
Use the same population for both parts of the calculation:
Bounce rate = (Sessions − Engaged sessions) ÷ Sessions × 100.
In an illustrative dataset with 100 sessions and 70 engaged sessions, 30 sessions were not engaged. Bounce rate is 30%, and engagement rate is 70%. With zero sessions, the rate is undefined; a spreadsheet should not turn the missing denominator into a reassuring 0%.
A session satisfying several engagement conditions still counts once. A buyer who reads for a minute and views three pages contributes one engaged session, rather than three. Keep this distinction when rebuilding a rate from exported data.
These four hypothetical journeys assume the default timer and complete, permitted collection:
| Journey | Observed duration | Views | Qualifying key event | Engaged? |
|---|---|---|---|---|
| Quick departure | 4 seconds | 1 | No | No |
| Single-page reader | 25 seconds | 1 | No | Yes |
| Quick purchase | 4 seconds | 1 | Yes | Yes |
| Short two-page visit | 4 seconds | 2 | No | Yes |
Bounce rate also differs from an exit measure. GA4's Exits metric concerns the page or screen where a session's last event occurred. A satisfied purchaser can exit after an engaged session. Entrances and exits.
1. Are you comparing the same sessions and metric definition?
First align the property, stream, period, dimensions, filters and session definition. A difference between two reports is useful only after those inputs describe the same population.
Save the report configuration before investigating. Add Sessions and Engaged sessions beside Bounce rate where the report supports them. Google allows Editors and Administrators to add engagement and bounce metrics to detail reports through Customize report → Metrics. Overview cards use another customization surface. Adding the metrics.
Compare a completed period and keep the reporting time zone consistent. Remove a comparison or filter only in a duplicate investigation view, so the original report remains reproducible.
Check whether the baseline came from Universal Analytics. Its legacy bounce measure used single-page, single-request sessions, while GA4 uses engaged sessions. Carrying a historical UA benchmark into GA4 can make an unchanged journey look improved. Universal Analytics' legacy definition.
For acquisition decisions, start with the landing page and acquisition population that answer the question. An analysis of every page visited during sessions answers a different question from whether a specific entry page attracted an appropriate audience. Keep the report's counting scope in its saved definition.
An analytics and tracking review should settle that denominator before diagnosing a design problem. A correct calculation over an unintended population can still lead the growth team to the wrong action.
2. Are duplicate page views making short visits look engaged?
Inspect whether one real page or route produces more than one page_view in the same session. An unintended second view can satisfy the view-count condition even when the visitor leaves quickly.
Inventory the senders: application code, GTM, CMS integrations and any route-change tracking. Google warns that manually sending page views alongside automatic measurement can create duplicates. Page-view measurement.
Reproduce four navigation cases:
- A direct first load of the landing page.
- A navigation to another genuine page or application route.
- Browser Back to the previous route.
- A refresh of the current page.
For each, save the actual location and the requests associated with that navigation. Define the expected page views before changing the configuration. Repeated legitimate navigation can create another view; the defect is an extra sender representing the same intended view.
For a single-page application, decide which mechanism owns virtual navigation. Google's manual GTM approach disables automatic history-based page views before adding its own history-change path. SPA measurement with GTM. Use the single-page app tracking guide for the complete route tests.
Avoid removing a sender solely because two events have the same name. Establish whether they represent the same view, then repair that specific duplication. Afterward, check both the view count and the affected bounce-rate cohort.
3. Did the key-event list change what counts as engagement?
Review which qualifying events can occur early in the affected sessions and whether their collection or designation changed. A low-effort action marked as a key event can make a short session engaged without demonstrating a purchase, accepted lead or useful product milestone.
Google explicitly excludes first_visit, first_open and session_start from engaged-session calculation even when marked as key events. Do not diagnose a bounce-rate change from their key-event labels alone. Engagement exceptions.
Trace the marked event to its success condition. A “form success” event firing on every Submit click can classify failed forms as valuable outcomes. A timer-created business event can make engagement appear stronger while customers do exactly the same thing.
Use the GA4 key-event guide to separate event collection, key-event marking and advertising goals. Review any campaigns depending on the outcome before changing its designation. A bounce-rate investigation should not quietly replace the campaign's conversion signal.
Keep one successful and one failed journey in the acceptance set. The successful action should qualify according to its intended definition; the failed action should not acquire a false success event. Counting once per session is not a substitute for fixing a trigger that reports success prematurely.
4. Did the engagement timer or measured time change?
Inspect the web stream's engagement timer and distinguish it from session timeout. The engagement timer controls time-based qualification; session timeout controls when inactivity ends a session. Google's tag settings expose both under Adjust session timeout, with a default ten-second engagement threshold and a default thirty-minute inactivity timeout. Google tag settings.
Record the current settings and the point at which any deliberate change became effective. Raising the engagement threshold changes the measurement definition. It is not evidence that the website suddenly became less useful.
Keep browser time and recorded engagement time distinct too. Google measures user engagement using time when a web page is in focus or an app screen is in the foreground, and sends it through engagement_time_msec. User engagement measurement.
A tab left open while someone works elsewhere is therefore a poor acceptance test for active reading. Reproduce the actual foreground journey and inspect the collected events. Test a quick departure and a longer single-page interaction without adding an artificial key event to force the expected result.
If time or events are absent, use the GA4 DebugView investigation to locate the collection problem. Preserve the approved consent behavior during the test. Changing consent simply to recover a familiar engagement rate would change the measured population as well.
5. Did the traffic mix change, or did someone average percentages?
Recompute the overall rate from session counts and inspect the groups contributing to it. The overall bounce rate can rise even when every group's own bounce rate stays unchanged.
Consider this fictional acquisition mix. Each period contains 1,000 sessions, with no measurement changes:
| Traffic group | Period A sessions | A bounce rate | Period B sessions | B bounce rate |
|---|---|---|---|---|
| Returning brand demand | 900 | 30% | 100 | 30% |
| New prospecting traffic | 100 | 70% | 900 | 70% |
Period A has 900 × 30% + 100 × 70% = 340 bounced sessions, so its overall rate is 34%. Period B has 100 × 30% + 900 × 70% = 660, giving 66%. The increase is 32 percentage points. Each group's behavior is unchanged; the larger share of prospecting traffic explains the aggregate shift.
A simple average of 30% and 70% gives 50% in both periods and conceals the change. For an aggregate spreadsheet or dashboard, divide the total bounced sessions by total sessions. Use mutually exclusive, collectively complete groups; a session appearing in two groups would be double-counted.
Check the same effect by landing page, device and meaningful campaign group. A new region or unfamiliar source merits investigation, but low engagement alone does not establish spam. Follow the GA4 spam diagnosis before excluding a population.
Once measurement and composition are understood, assess the business result. A prospecting page may have a higher bounce rate and still acquire worthwhile customers at an acceptable cost. Compare qualified outcomes, downstream revenue and the page's intended job before declaring a universal target.
How should you reconcile bounce rate with a warehouse calculation?
Align the session population and engagement classification before comparing a warehouse result with the GA4 interface. Event count, user count and session count are different denominators.
Google advises combining the user identifier with session ID to identify sessions outside Analytics. It also notes that session identifiers are not automatically attached by Measurement Protocol or Data Import, and that the interface estimates session counts. GA4 session behavior.
Keep missing identifiers in an explicit exception population instead of treating every missing ID as one session. Use the GA4 BigQuery sessionization guide for the event-level implementation and boundaries. Avoid inferring engagement from the number of arbitrary events: a scroll, an engagement update and a page view are not three page views.
For the illustrative 100-session example, assign one final engagement status to each session. Suppose 25 qualify only by time, 15 only by views, 10 only by a qualifying key event, 20 by several conditions and 30 by none. Engaged sessions are 25 + 15 + 10 + 20 = 70. The group meeting several conditions contributes twenty sessions once.
If a reconciliation differs, record missing session keys, scope, export coverage and the classification rule before adjusting a calculation to match a displayed percentage. A close total can hide different sessions in each result.
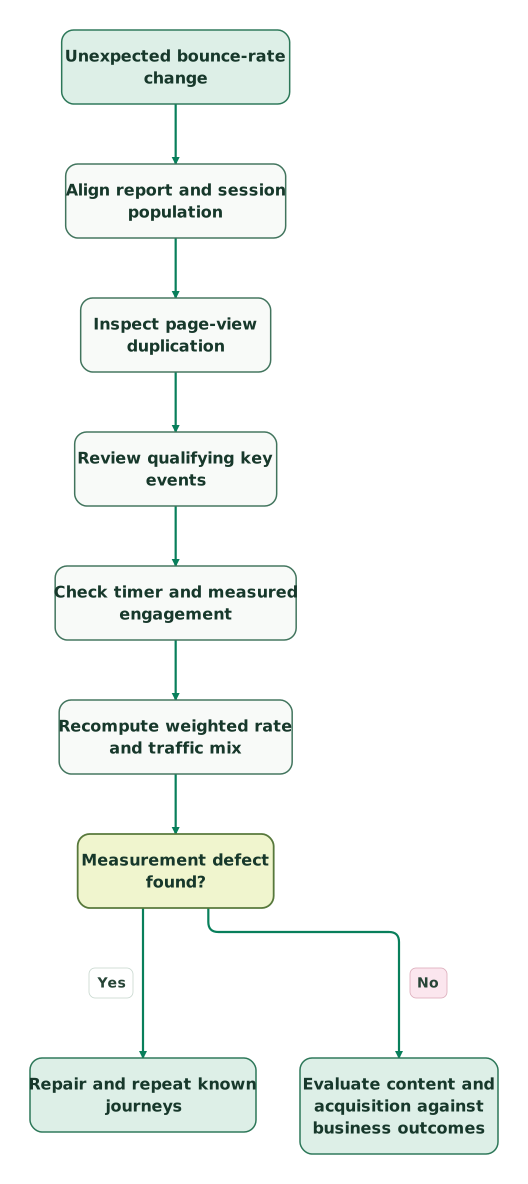
Read diagram as text
- Unexpected bounce-rate change to Align report and session population.
- Align report and session population to Inspect page-view duplication.
- Inspect page-view duplication to Review qualifying key events.
- Review qualifying key events to Check timer and measured engagement.
- Check timer and measured engagement to Recompute weighted rate and traffic mix.
- Recompute weighted rate and traffic mix to Measurement defect found?.
- Measurement defect found? to Repair and repeat known journeys: Yes.
- Measurement defect found? to Evaluate content and acquisition against business outcomes: No
The investigation separates a measurement change from a customer-behavior change before either becomes a redesign or campaign decision.
What should pass before you call the bounce-rate issue fixed?
Close the issue when the observed rate follows the agreed definition and the original discrepancy has an evidence-backed explanation. An attractive percentage alone is not the acceptance condition.
Checklist
- Sessions, engaged sessions and bounce rate use the same reporting population.
- Each intended page view has a known collection owner.
- Qualifying key events require their actual success conditions.
- Engagement and inactivity timers are recorded separately.
- Quick, longer, two-page and successful-outcome journeys behave as expected.
- Aggregate rates use counts and nonoverlapping groups.
- Missing IDs and export coverage are visible in warehouse comparisons.
- Traffic composition is separated from within-group behavior.
- The business owner can explain what the metric says about the page's job.
For an analytics and tracking repair, keep the original report, representative journey evidence and the verified configuration with the handover. Add monitoring only after that baseline is understandable; a GA4 custom alert should detect a meaningful change in a trusted metric.
Keep reading
Browse all Tracking & Attribution guides
 Tracking & Attribution
GA4 setup for SaaS and apps: the events and settings that matter
Set up GA4 for a SaaS acquisition journey. Define events, test consent and cross-domain tracking, choose Ads goals and verify revenue, identity and export.
Jafrin Akter AloLast updated 14 min read
 Tracking & Attribution
GA4 Spam Traffic: Diagnose It and Filter the Right Data
Diagnose GA4 referral spam without losing real traffic. Use hostname filters correctly, understand the Measurement Protocol exception and preserve historical evidence.
Jafrin Akter AloLast updated 11 min read
 Martech AI
GA4 AI: Ask Advisor, AI Summaries and Answers You Can Check
What GA4's AI features do: Ask Advisor, homepage AI summaries and predictive metrics, with prompts and checks that make each answer hold up in a report.
Jafrin Akter AloLast updated 11 min read
Analytics & tracking
See the implementation scope, deliverables and acceptance checks.
Questions people ask
How should countries with different consent experiences be compared?
Compare the measured populations and collection rules before interpreting a country difference as audience behavior. Record the consent experience, eligible events and known coverage for each group. Use compatible definitions and explain remaining differences in observation. A lower measured bounce rate in one country does not establish that its visitors are more satisfied when the collection paths differ.
Should a pricing page and a help article share one bounce-rate target?
Choose a target only after defining each page's job and comparable audience. A help article may satisfy a question on that page, while a pricing page may aim to move a qualified visitor toward a trial or conversation. Inspect downstream outcomes and measurement consistency before comparing them. A shared percentage target can reward extra navigation without improving the customer experience.
How should bounce rate be formatted when a connector returns a fraction?
Confirm the field's unit before applying percentage formatting. If a connector returns a fraction of 0.34, that represents 34%; multiplying by 100 and then applying percentage formatting would display 3,400%. If the source already returns 34 percentage units, handle it accordingly. Preserve the raw value beside a known example so a dashboard formatting change cannot silently rescale the metric.
What should an experiment report say if its variants use different event setups?
Treat the measurement difference as a comparability issue before interpreting the bounce-rate result. Inspect page-view ownership, key-event triggers and timer settings in both variants. Repair or explicitly account for the difference, then compare outcomes over a compatible population. A variant that sends an extra view can appear more engaged even when its users behave like the control group.
Should a bounce-rate increase automatically pause a campaign?
Use the increase as an investigation signal alongside cost, qualified outcomes and measurement evidence. A traffic-mix change can raise the overall rate without worsening behavior within any group. Conversely, a tracking defect can make the campaign look healthier than it is. Follow the campaign's agreed decision rules and confirm the relevant business impact before changing delivery solely because of this metric.
Sources

Written by
Jafrin Akter AloData Engineer and Co-founder at Martechdevs and Growth and Analytics Partners
Jafrin writes practical guides to marketing technology, customer data, analytics and AI workflows. Martechdevs is a Growth and Analytics Partners company.