
GA4 DebugView Not Showing Events: 7 Checks to Find the Break
When GA4 DebugView is empty, trace one known event from the action that creates it to the property receiving it. Check the destination, debug setting, trigger, request, consent state and delivery path before changing your tracking. An empty debugging screen alone cannot tell you whether collection failed or whether the event was eligible to appear there.
On this page
This guide focuses on website debugging with Google Tag Manager or a code-owned Google tag. Native apps have their own debug settings. If events already appear in DebugView but disappear from completed reports, use the GA4 event-report troubleshooting guide.
What evidence should you collect before changing GA4?
Collect one reproducible action and the evidence at each stage of its delivery. Choose an existing, nonfinancial event in a test environment where possible. Record the page, event name, expected property, approximate action time, consent choice and whether the page uses a published container or a preview draft.
For a form, define success as the application accepting the submission. A button click and an accepted lead are different checkpoints. Keep a failed submission as a second test so a tracking repair cannot quietly turn every attempt into a lead.
Use this investigation record. Its values illustrate a test, rather than a result from a customer account.
| Checkpoint | Example evidence to save | Question it answers |
|---|---|---|
| Application outcome | Test form accepted; no personal fields copied | Did the intended action actually happen? |
| Tag execution | The selected event in Tag Assistant and its evaluated variables | Did the sender run with the expected inputs? |
| Outbound request | Destination, event name, response and sanitized payload | What left the page? |
| Intermediate server, if used | Incoming event and outgoing GA4 request | Was the event forwarded correctly? |
| DebugView | Selected property, device and event parameters | Did the intended debugging view receive it? |
Keep full request captures in an access-controlled investigation folder. URLs, headers and event parameters can contain customer information or credentials. Share only the fields needed to explain the fault.
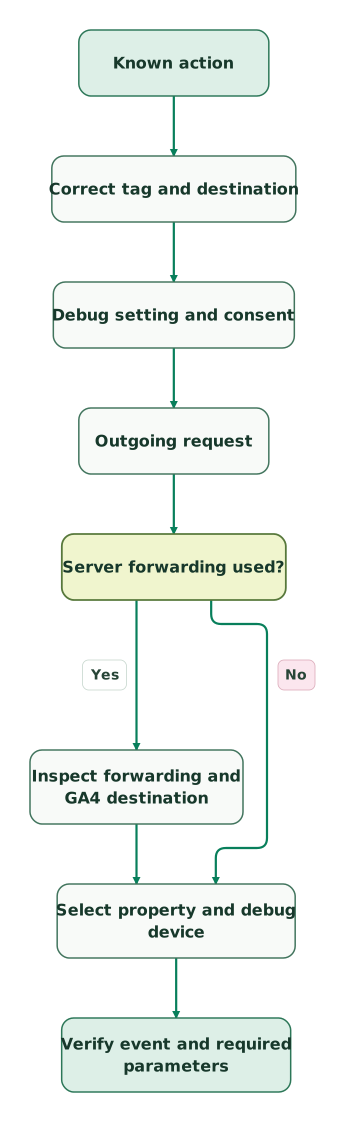
Read diagram as text
- Known action to Correct tag and destination.
- Correct tag and destination to Debug setting and consent.
- Debug setting and consent to Outgoing request.
- Outgoing request to Server forwarding used?.
- Server forwarding used? to Inspect forwarding and GA4 destination: Yes.
- Server forwarding used? to Select property and debug device: No.
- Inspect forwarding and GA4 destination to Select property and debug device.
- Select property and debug device to Verify event and required parameters
The event trace follows the actual sender. A server forwarding layer adds another checkpoint between the browser request and the selected GA4 property.
1. Is the event going to the GA4 property you are watching?
Compare the actual destination in the emitted request with the web stream in the selected GA4 property. A property name can look correct while the page still sends to another environment.
Open the intended property's web stream and copy its measurement ID into your private test record. Inspect the configured Google tag, the event tag's destination and the request emitted for the action. Google's collection troubleshooting guide includes checking the measurement ID and confirming that collection requests reach Analytics.
Trace the event on the page where it happens. A marketing homepage and an application can load different containers. A checkout redirect can move the test to another hostname. A staging environment can deliberately use a different property.
If the destination changes during the journey, identify the configuration responsible before replacing IDs globally. Preserve the environment separation documented in your GA4 setup. The repair should route the intended event correctly without mixing staging activity into production.
2. Is debug mode enabled for this device and event?
DebugView requires debug mode; ordinary traffic does not automatically appear there. For website testing, use Tag Assistant or GTM Preview for the individual test session. If you set the flag in a tag, use debug_mode: true on the intended test traffic. Remove that parameter when finished; setting it to false does not disable debug mode. Google's DebugView instructions.
Inspect the event being investigated, rather than assuming a visible page view proves every later event shares its settings. A custom event can use a different tag, sender or configuration path.
Keep the scope narrow. Publishing debug mode for every visitor makes the device list noisy and can interact with developer-traffic exclusions. A developer filter allows DebugView testing while excluding that debug traffic from reports. Google's developer-traffic filter.
For a native Android or Apple app, use the Firebase DebugView setup for the development device and correct app build. A browser preview session cannot enable debugging inside a native app. Record the app environment separately from the website property check.
3. Does the intended action trigger the tag in the configuration being tested?
Check the exact action in Tag Assistant and confirm that its trigger conditions and variables resolve as intended. GTM Preview runs the workspace draft for your test session, so a successful preview does not establish that the same version is published. Google's preview guidance.
Select the timeline event associated with the business action. Inspect the event tag, its trigger conditions and the variable values at that point. Check conditions individually: hostname, page path, custom-event name and any success flag.
For example, a form can dispatch its success event before a variable containing the form type is available. Moving through the timeline may show that variable later, but the tag needed it at the original action. Fix the timing or event contract rather than replacing a specific trigger with “all clicks.”
If a tag fires only in preview, compare the draft with the published version and check whether the preview connection survives the redirect. If the target page behaves differently when Tag Assistant adds its debug URL parameter, Google's preview settings include an option to omit that parameter. Record the resulting debug behavior separately.
Keep the event naming and ownership rules beside the repair. Renaming an event to make a trigger match can create a second reporting series when the intended fix was one incorrect condition.
4. Does the browser actually send the GA4 request?
Inspect the browser's Network panel while reproducing the action. A tag's execution status and a completed network request are different pieces of evidence.
Open the panel before the action and preserve the log across navigation. Find the request carrying the event name. Direct GA4 traffic commonly uses a /g/collect request to Google's collection domains; a first-party server endpoint can use another host. Google's troubleshooting procedure identifies successful collection responses such as HTTP 200 or 204.
Use the response to establish transport progress. Continue checking the destination and payload; a successful response alone does not establish the business meaning of the event.
| Network evidence | Next check | Repair boundary |
|---|---|---|
| No matching request | Trigger, JavaScript error, tag loading and consent state | Find the first missing execution step |
| Request blocked | Browser message, extension or network policy | Identify the specific blocking control |
| Request canceled on navigation | Sender timing and page transition | Preserve reliable delivery at the actual outcome |
| Request succeeds to another destination | Event destination and environment configuration | Correct the responsible sender |
| Request reaches your collection server | Server logs and outgoing request | Trace the remaining forwarding step |
If the console reports Content Security Policy blocking, save the blocked URL and directive. Have the site's security owner review the relevant policy against Google's CSP requirements. Disabling the entire policy would hide the cause and expand the change unnecessarily.
A clean test browser can isolate extension interference, but keep the original failing browser as a regression case. Success in a second browser narrows the investigation; it does not establish that the original customer's path is repaired.
5. Does the consent state permit the expected debugging behavior?
Check the actual consent state when the event runs and compare it with the approved collection policy. Google says client-side privacy controls or missing consent for Analytics cookies can prevent events appearing in DebugView. DebugView privacy behavior.
In Tag Assistant, inspect the initial consent state, the update after the visitor's choice and the tag's behavior at the event. Google's consent debugging procedure covers these checkpoints.
Test a first visit and a returning visit with a saved choice. Then reproduce the transition that fails, such as moving from a marketing page to a signup app. Write the expected behavior before testing, including what should happen after denial.
If the test permits Analytics collection but the update arrives after the one-time success action, investigate that ordering. If the visitor declines Analytics storage, preserve that choice and evaluate the appropriate consent-mode behavior. A consented test event can help isolate a technical defect, but it cannot stand in for every visitor's permission state.
Do not infer permission from a closed banner. The evidence is the state used by the sender at the relevant moment.
6. Does a server integration preserve the event's delivery path?
For server-side collection, inspect both the received event and the request forwarded to GA4. Browser delivery to your endpoint proves only that the first leg completed.
Record which component owns the outgoing event name, measurement ID, parameters and debug setting. Compare the incoming and outgoing representations. A transformation can rename a field, drop a value or route one environment differently.
Measurement Protocol adds a separate distinction: /debug/mp/collect validates a payload and does not send its events into reports. Its regular collection endpoint also does not return detailed validation errors for every malformed event. Use Google's Measurement Protocol validation workflow before testing actual collection through the intended path.
Keep API secrets on the server and out of screenshots or browser-side examples. For the full identity and session design, use the GA4 Measurement Protocol guide. Adding a server sender during a debugging session requires explicit ownership and duplicate handling; it is a separate implementation change.
7. Are you inspecting the right device and time window in DebugView?
Select the intended DEBUG DEVICE and inspect the matching time in the chosen property. DebugView's seconds stream covers the latest minute, while its minutes stream lets you inspect the preceding 30 minutes. Google's DebugView interface guide.
Trigger a recognizable sequence of existing test actions, such as opening a specific page and submitting the test form once. Use that sequence and its time to identify your device. Avoid adding personal details to an event merely to recognize yourself.
Once the event appears, open its parameters. Check the required business fields, the success condition and the number of observed occurrences. Finding the event name closes the visibility question; it still leaves payload correctness and false-positive triggers to verify.
Realtime can provide another observation, but Google describes that report as best effort. A temporary empty Realtime card is insufficient evidence to reinstall tracking. Realtime behavior and limits.
How do you decide whether the DebugView repair is complete?
A DebugView repair is complete when the original action reaches the intended device view with the correct parameters and the failed-action case behaves as defined. Keep the configuration change small enough that the test can explain what it fixed.
Checklist
- The tested page and application build match the intended environment.
- The request goes to the expected GA4 destination.
- Debug mode is limited to the intended test traffic.
- Trigger inputs are correct at the moment the event runs.
- Consent defaults and updates match the approved behavior.
- Any server forwarding step preserves the required information.
- The correct debug device shows the expected event and parameters.
- A failed action and a repeated action produce their defined results.
- The published configuration receives its own acceptance check.
If all transport evidence is present and DebugView remains empty, preserve the minimal reproduction for the responsible implementer or support channel. Include the stream, event, sanitized request, debug setting and consent evidence. That gives the next person a specific failure to investigate.
Use the tracking break map skill to keep passed, failed and unchecked layers explicit while tracing the same journey beyond DebugView.
An analytics and tracking review should leave your team with that evidence and a repeatable release check. Once DebugView passes, validate processed reporting separately before using the event for a campaign or business KPI.
Keep reading
Browse all Tracking & Attribution guides
 Tracking & Attribution
GA4 setup for SaaS and apps: the events and settings that matter
Set up GA4 for a SaaS acquisition journey. Define events, test consent and cross-domain tracking, choose Ads goals and verify revenue, identity and export.
Jafrin Akter AloLast updated 14 min read
 Tracking & Attribution
GA4 Bounce Rate Looks Wrong? 5 Checks Before You Change the Page
Diagnose unexpected GA4 bounce rates. Check duplicate views, key events, engagement timers, session scope and weighted averages before changing your page.
Jafrin Akter AloLast updated 10 min read
 Product Analytics
GA4 Alternatives: Choose by the Questions You Need to Answer
Compare Plausible, Matomo, Mixpanel, PostHog and a warehouse by the decisions they support. Use a controlled pilot and preserve critical GA4 dependencies.
Jafrin Akter AloLast updated 13 min read
Analytics & tracking
See the implementation scope, deliverables and acceptance checks.
Questions people ask
Can a browser tab without Tag Assistant still send valid GA4 events?
Yes. A regular website tab can send GA4 events without being connected to Tag Assistant. Debugging visibility depends on the test configuration, while ordinary collection follows the site's published setup. Compare the same permitted action in a preview session and a normal session, keeping the environment and consent choice consistent. Record which observation belongs to each session before comparing their reports.
Should I install a second GA4 tag to make the debug device appear?
Inspect the existing sender before installing another tag. A second installation can add page views or purchases while leaving the original destination or consent problem unresolved. Inventory the code, CMS integration, GTM container and any server sender. Keep one agreed owner for each event, then repair the demonstrated failure and repeat the same action through that owner.
Why does the debug session disappear after a login redirect?
A login redirect can move the test into another hostname, page context or application configuration. Follow the redirect chain and verify the destination tag, debug state and consent state after login. Preserve the network log so the transition remains visible. Treat any lost debugging connection separately from whether the authenticated application actually sent the intended event to GA4.
Can I use a purchase event as a quick DebugView test?
Use a nonfinancial event or a separate test property when possible. A synthetic purchase can enter revenue reporting or linked advertising workflows if the environment allows it. When purchase testing is necessary, use the approved test flow with identifiable test transactions and documented exclusions. Verify failed payments and retries alongside the successful transaction so the test covers its business meaning.
What should I send an engineer when only one teammate can reproduce the issue?
Send the failing journey, browser context, application version, consent choice, target stream and sanitized request evidence. Include the same details from the successful teammate's session. Compare one difference at a time, such as an extension, saved consent state or environment URL. This creates a reproducible investigation without assuming that the teammate's device or the Analytics property is the cause.
Sources
- Google: Troubleshoot GA4 collection
- Google: Monitor events in DebugView
- Google: Filter out developer traffic
- Firebase: DebugView for development devices
- Google: Preview and debug containers
- Google: Content Security Policy for tags
- Google: Troubleshoot consent mode
- Google: Validate Measurement Protocol events
- Google: Realtime report

Written by
Jafrin Akter AloData Engineer and Co-founder at Martechdevs and Growth and Analytics Partners
Jafrin writes practical guides to marketing technology, customer data, analytics and AI workflows. Martechdevs is a Growth and Analytics Partners company.