
Data Warehouse Examples: Fact Tables, Dimensions and Reliable Totals
A useful data warehouse example shows what one row represents, which dimensions describe it and how a business total is calculated. Order lines, inventory snapshots and campaign-day results need different grains and aggregation rules. Start with the decision and expected records, then build the warehouse model that preserves those meanings. A tidy schema is insufficient if its joins or totals answer the wrong question.
On this page
Data warehouse examples by business question
The examples below are synthetic and use small populations that can be checked independently.
| Business question | Fact-table grain | Useful dimensions | Main aggregation risk |
|---|---|---|---|
| Product sales | One accepted order line | Product, customer and order date | Repeated order totals across lines |
| Closing inventory | One product-location snapshot at a defined time | Product, location and snapshot date | Adding balances across time |
| Campaign efficiency | One campaign-day result | Campaign, channel and date | Averaging ratios without their denominators |
| Customer journey | One defined business event | Customer, account and event date | Confusing events with unique people |
Kimball describes grain as the business meaning of a fact-table row, rather than merely its list of keys. Microsoft's star-schema guidance distinguishes facts used for summarization from dimensions used for filtering and grouping. See fact-table grain and star-schema concepts.
We would write the expected total and a few included and excluded records before drawing the schema. That makes the model testable and helps the business owner explain why a row belongs in the result.
At Martechdevs, data warehouse implementation connects source records to maintained analytical models. We use known examples to verify grain, relationships and metric definitions before those models become the basis of dashboards or activation.
Fact and dimension tables
A fact table records observations at a consistent grain. Its measures might include quantity, extended sales amount, spend or an inventory balance. A dimension table provides descriptive context, such as a product category, customer segment, location or date.
The distinction concerns the table's purpose. A column being numeric does not automatically make it an additive measure. A product identifier is a key; a unit price is a rate; a line amount is an extended value. Those columns support different calculations.
In a star schema, facts relate to dimensions through keys. The expected relationship usually gives each fact one applicable dimension row for the chosen meaning and time. A missing key can drop records from an inner join, while a duplicated dimension key can multiply them. See Microsoft's fact and dimension guidance.
The data warehouse design guide covers the broader architecture and implementation process. The examples here focus on the records, joins and calculations that make that design useful.
Order-line sales example
Assume two hypothetical accepted orders. Order O1 contains two lines, while O2 contains one. Amounts are USD and unit prices are stored as integer cents for the reproducible query.
| Order and line | Customer key | Product key | Quantity | Unit price, USD |
|---|---|---|---|---|
| O1, line 1 | C1 | 1 | 1 | $40 |
| O1, line 2 | C1 | 2 | 2 | $30 |
| O2, line 1 | C2 | 1 | 2 | $40 |
Product 1 belongs to Core and product 2 belongs to Add-on. The line values are $40, $60 and $80, producing $180 in total sales value across two orders and five units. This fixture excludes tax, shipping, returns and discounts so the arithmetic has one explicit meaning.
The following self-contained SQL runs in SQLite. It includes the sample facts and product dimension, then calculates category totals. Other SQL systems may require small syntax adjustments.
WITH order_lines(order_id, line_no, customer_key, product_key,
                 quantity, unit_price_cents) AS (
  VALUES ('O1', 1, 'C1', 1, 1, 4000),
         ('O1', 2, 'C1', 2, 2, 3000),
         ('O2', 1, 'C2', 1, 2, 4000)
), products(product_key, category) AS (
  VALUES (1, 'Core'), (2, 'Add-on')
)
SELECT p.category,
       SUM(f.quantity) AS units,
       SUM(f.quantity * f.unit_price_cents) / 100.0 AS sales_usd,
       COUNT(DISTINCT f.order_id) AS orders
FROM order_lines AS f
JOIN products AS p ON p.product_key = f.product_key
GROUP BY p.category
ORDER BY p.category;
The output is Add-on with two units, $60 and one order, plus Core with three units, $120 and two orders. The sales amounts and units add to the overall totals. The grouped order counts do not: O1 appears in both categories, so adding one and two would count three category memberships rather than two distinct orders.
This query assumes every product key resolves to exactly one dimension row. Validate missing and duplicated keys before using the inner join. A correct-looking category chart can otherwise omit a product or duplicate its contribution.
In a production model, the extended line amount may be stored directly after the agreed discount and currency rules are applied. Keep unit price available when useful, but do not sum unit prices as if they were sales value. Kimball's fact-table discussion explains the importance of measures consistent with the declared grain.
Order-level values and relationship multiplication
An order-level value belongs to one order, even when the order has several lines. Shipping, an order-wide discount or a customer-level balance can be repeated when joined to line facts. Summing the repeated value changes its meaning.
Decide whether the measure should remain at order grain or be allocated to lines using an approved rule. An allocation must preserve the order total and document its basis. Do not let the number of lines decide the result accidentally.
The same issue appears in marketing and CRM data. A customer with several contacts can multiply a contract amount, and an order with several campaign touches can multiply revenue. More relationships do not automatically provide a better reporting model.
Use the marketing metric contracts guide to define the intended measure. Retain the source key and an independent total so the join can be checked before additional dimensions are introduced.
Periodic inventory snapshot example
A snapshot represents state at a defined time or period, rather than a new transaction each time the row is stored. Assume one location records closing inventory for two products at the end of January and February.
| Snapshot month | Product A units | Product B units | Closing total units | Interpretation |
|---|---|---|---|---|
| January | 100 | 200 | 300 | Stock at the January cutoff |
| February | 120 | 0 | 120 | Stock at the February cutoff |
The two closing totals add numerically to 420, but that is not the stock at either cutoff. A report asking for February closing stock should return 120. A report asking for average month-end stock across these two equally weighted snapshots would return 210, under that explicitly defined calculation.
Kimball's periodic snapshot guidance distinguishes a period grain from an individual transaction. The time meaning belongs in the table and report definition, not only in a chart title.
Zero and missing also differ. Product B's February zero means the sample deliberately records no remaining stock at that cutoff. A missing row might instead mean the source was unavailable or the snapshot failed. Do not turn every missing balance into zero without an approved completeness rule.
State measures often need different time aggregation from transaction measures. The same caution applies to active subscriptions, account balances and pipeline snapshots. Choose a closing value, an average or another defined calculation instead of summing every available date by habit.
Campaign-day performance example
Campaign results commonly arrive at a campaign-date grain, sometimes with additional dimensions such as device, placement or geography. Keep those dimensions explicit: a campaign-day total and a campaign-day-device breakdown are not interchangeable rows.
The following synthetic example has three campaign-day records. All spend is USD.
| Campaign and day | Spend, USD | Clicks | Row cost per click, USD |
|---|---|---|---|
| Campaign A, day 1 | $100 | 50 | $2.00 |
| Campaign A, day 2 | $200 | 50 | $4.00 |
| Campaign B, day 1 | $150 | 100 | $1.50 |
Total spend is $450 and total clicks are 200. Combined cost per click is $450 divided by 200, or $2.25. An unweighted average of the three row ratios is $2.50 and answers a different question because the rows have different click counts.
Store or retain the components needed to recompute the ratio after filtering. When a reader selects Campaign A, the result should become $300 divided by 100 clicks, or $3.00. A precomputed ratio column alone is insufficient for many useful aggregations.
The marketing data warehouse guide places those source feeds in a broader reporting architecture. Reconcile source totals at the same grain, time zone, currency and reporting window before interpreting a difference between tools.
Changing dimensions and historical meaning
Dimensions can change. A product can move category, a customer can move segment and a sales owner can move region. The model needs to specify whether historical facts should use the value at the time of the event or the current value.
Microsoft's star-schema guidance distinguishes Type 1 changes, which overwrite a dimension attribute, from Type 2 changes, which retain versions with validity ranges and keys. The appropriate choice depends on the meaning of the report. See changing dimensions.
For example, moving Product 1 from Core to Premium can either restate all historical sales under its current category or preserve Core for earlier sales. Neither interpretation should happen accidentally. Name the report's policy and maintain the corresponding dimension keys or lookup rule.
Keep the business identifier separate from a particular historical version when versioning is required. A product remains the same business item while its descriptive state can have several valid versions. A join on only the business identifier may match more than one historical row if the time condition is omitted.
Test a fact before the change, one after it and one exactly at the defined boundary. The late-arriving data guide helps address records that arrive after their business period or before their descriptive context is ready.
Warehouse layers and reporting scope
These examples can live within a warehouse architecture that separates source-like input, validated records and business-facing models. The layer names matter less than the responsibility and quality state of each dataset.
Keep the source evidence needed to explain a model while controlling access and retention appropriately. A curated sales table can omit operational fields that remain useful in a restricted source layer for debugging. The report should use the accepted business model rather than whichever table was easiest to find.
A data mart is a scoped analytical collection serving a business area. A marketing mart can combine campaign facts with agreed customer outcomes, while a finance-oriented model may use different recognition and reconciliation rules. Shared keys and definitions help those areas compare results without forcing them into one oversized fact table. See AWS's data-mart distinction.
The warehouse and data lake comparison covers storage and analytical responsibilities. The warehouse and database comparison separates analytical work from operational transaction requirements.
Model validation and failure cases
| Check | Known case | Expected result | Failure meaning |
|---|---|---|---|
| Grain uniqueness | Repeated order-line key | One accepted row or an explicit correction | Duplicate business observation |
| Dimension match | Fact with unknown product key | Defined unknown handling or quarantine | Silent join loss |
| Relationship cardinality | Duplicate product dimension key | Rejection or repaired dimension | Multiplied fact rows |
| Time aggregation | Two month-end balances | Selected closing value or defined average | Stock values summed across time |
| Ratio aggregation | Campaign rows with unequal clicks | Total spend divided by total clicks | Unweighted ratio average |
| Historical dimension | Product category change | Agreed current or historical interpretation | Unintended restatement |
The marketing data quality guide helps turn those checks into operating evidence. A warehouse test should explain the business consequence of failure, not merely show that a query returned a number.
A practical modeling sequence
- Select one business decision and define the result it needs.
- Declare what one fact row represents, including its time meaning.
- Identify descriptive dimensions and their valid keys.
- Define additive amounts, counts, balances and ratios separately.
- Build a small sample with independently known totals.
- Test joins, missing keys, repeated rows and historical changes.
- Reconcile the report after representative filters are applied.
- Assign source and model owners before adding more business areas.
Use the dashboard templates tool to agree the report's question and layout after the model's numbers reconcile. A new visualization should not become the place where conflicting definitions are silently resolved.
Fact-grain selection and repair
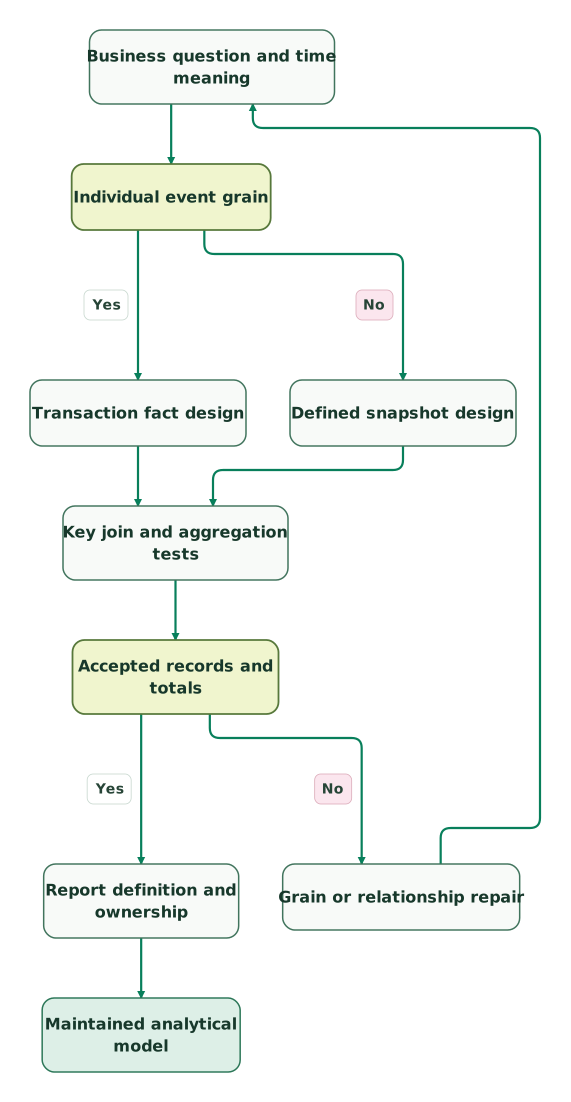
Read diagram as text
- Business question and time meaning to Individual event grain.
- Individual event grain to Transaction fact design: Yes.
- Individual event grain to Defined snapshot design: No.
- Transaction fact design to Key join and aggregation tests.
- Defined snapshot design to Key join and aggregation tests.
- Key join and aggregation tests to Accepted records and totals.
- Accepted records and totals to Grain or relationship repair: No.
- Grain or relationship repair to Business question and time meaning.
- Accepted records and totals to Report definition and ownership: Yes.
- Report definition and ownership to Maintained analytical model
Data warehouse example checklist
- A business definition of one fact row.
- Stable keys and an explicit source population.
- One applicable dimension row per intended fact relationship.
- Separate rules for amounts, distinct counts, balances and ratios.
- Currency, units and time cutoffs beside the measures.
- Known ordinary, missing, repeated and changed records.
- A declared current-versus-historical dimension policy.
- Reconciliation before and after joins and report filters.
- A source owner and a continuing model owner.
- Repeated acceptance checks after grain or relationship changes.
The marketing data audit skill helps preserve the source and model evidence. Keep the small examples with the warehouse documentation so a later maintainer can verify the same business meaning.
Keep reading
Browse all Data Warehouse guides
 Data Warehouse
Data warehouse design for a small company: layers, models and rules that prevent rework
Design a marketing warehouse around clear record grain, identity and history. Includes model examples, metric definitions and a first-project checklist.
Jafrin Akter AloLast updated 11 min read
 Data Warehouse
Marketing Metric Contracts: Make the Definition as Reliable as the Dashboard
Define reliable marketing metrics with clear grain, denominators, time windows, dimensions and tests. Includes an activation contract and worked examples.
Jafrin Akter AloLast updated 12 min read
 Data Warehouse
Marketing Data Warehouse: Sources, Models and Setup
Plan a marketing data warehouse finance trusts: sources to load, models to build, BigQuery or Snowflake choice, setup steps and a launch checklist.
Jafrin Akter AloLast updated 21 min read
Data warehouse & CDP
See the implementation scope, deliverables and acceptance checks.
Questions people ask
Can category-level distinct order counts be added to obtain the overall order count?
Category-level distinct order counts cannot always be added to obtain the overall count. One order can contain products from several categories and appear once in each category's result. Recompute distinct orders over the complete selected population instead. Additive sales amounts and non-additive distinct counts can coexist in the same report, so each measure needs its own aggregation rule.
Does a numeric column automatically belong among additive warehouse measures?
A numeric column is not automatically an additive measure. Identifiers, unit prices, rates and balances can be numeric while requiring different treatment from transaction amounts. Define what the value represents and which dimensions it can be summed across. Retain the components needed to calculate ratios and the time meaning needed to interpret snapshots before exposing the field to report authors.
Can an absent inventory snapshot be safely replaced with zero?
An absent inventory snapshot cannot safely be replaced with zero without a completeness rule. Zero can mean a known empty balance, while absence can mean a missing source, failed load or excluded entity. Preserve that distinction in the model and report. Check the expected product-location population at each cutoff before treating missing rows as measured zero stock.
Should a product-category change always rewrite historical sales reporting?
A product-category change should rewrite historical reporting only when that is the agreed interpretation. A current-category view can intentionally restate earlier sales, while a historical-category view preserves the description valid at the event time. Choose the dimension-change approach and join rule accordingly, then test records around the change boundary. See Microsoft's changing-dimension guidance.
Can a successful fact-to-dimension join still return the wrong sales total?
A successful join can return the wrong sales total when dimension keys are duplicated, facts are missing matches or the relationship uses the wrong historical version. The database can execute valid SQL without knowing the intended business grain. Reconcile key coverage, row counts and known amounts before and after the join, rather than treating query completion as evidence of correctness.
Sources

Written by
Jafrin Akter AloData Engineer and Co-founder at Martechdevs and Growth and Analytics Partners
Jafrin writes practical guides to marketing technology, customer data, analytics and AI workflows. Martechdevs is a Growth and Analytics Partners company.