
HubSpot Dashboards: Setup, Filters and Reliable Reporting
A HubSpot dashboard should answer a defined operating question with reports that agree on records, dates and access. Start with a small set of reconciled measures, then add filters and distribution. The useful result is a view a sales or marketing owner can explain, including the records behind a total and the action that follows it.
On this page
Dashboard Scope
Choose the recurring decision before selecting a dashboard template.
| Dashboard | Main decision | Starting measures | Owner |
|---|---|---|---|
| Sales pipeline | Deals needing attention this week | Open amount, overdue close dates, owner exceptions | Sales operations |
| Marketing handoff | Qualified enquiries awaiting action | Eligible enquiries, assigned records, accepted handoffs | Marketing operations |
| Customer service | Work needing reassignment or escalation | Open tickets, age, queue ownership | Support operations |
| Executive review | Progress against an agreed plan | Selected outcomes, trends and material exceptions | Revenue operations |
Keep each view focused on one meeting or workflow. A dashboard containing every available report creates competing definitions: one chart might count contacts created this month while another counts deals expected to close this month. Both can be correct without describing the same population.
For a first sales dashboard, write a short specification: open deals in the new-business pipeline, expected close date within a fixed month, amounts in USD, grouped by deal owner. Add an exception table for missing owners or overdue dates. That is a clearer starting point than a collection of attractive charts.
If the underlying stages, ownership rules or lifecycle events are inconsistent, CRM and lifecycle implementation can connect those definitions to the records and workflows feeding the dashboard. Dashboard design starts with the operating process.
Reporting Prerequisites
HubSpot makes dashboards available across products and plans, while the account's highest subscription tier determines dashboard limits. Access to a dashboard does not grant access to every report or its underlying data. Review report sharing and data permissions separately. HubSpot dashboard management.
Custom reporting has additional entitlements. HubSpot lists Professional and Enterprise subscriptions for custom reports and requires Create/own and Edit report permissions. Limits from subscriptions at the same tier do not simply add together. Confirm the required report type in the account before designing around it. Custom report availability.
Record five decisions in the dashboard specification:
- Population: The object, pipeline and inclusion rules behind each measure.
- Date: The actual property and time window, such as deal Close date rather than Create date.
- Unit: Records, currency, elapsed days or a clearly defined percentage.
- Audience: The users who need the result and the records they should be allowed to see.
- Action: The follow-up triggered by an exception or change.
For multi-currency accounts, select a defined currency basis before adding amounts. Keep original amounts and the chosen reporting currency distinguishable in the reconciliation file. A display label alone does not explain the conversion policy.
Our HubSpot implementation checklist covers the wider process setup. This guide concentrates on native HubSpot reporting, its filters and the evidence needed to trust a dashboard after launch.
Dashboard Setup
Dashboard Shell
- Open Reporting, then Dashboards, using More first if that is how navigation appears in the account.
- Select Create dashboard and choose an appropriate template or a blank dashboard.
- Give it a purpose-based name, such as Monthly New Business Review.
- Select the intended dashboard access and create it.
HubSpot's creation flow supports templates and a blank starting point. Super Admins and users with Reports & dashboards permission can manage dashboards regardless of their ownership or visibility. Private ownership therefore does not mean administrators cannot access the dashboard. Dashboard creation and access.
Use a blank dashboard when the default template introduces measures the team cannot yet define. A template is useful when its reports match the process, but the report names still need examination. Confirm the date property, stage population and owner field inside each retained report.
Report Construction
- Create or select one report for the main outcome.
- Confirm the data source and fields before choosing the visualization.
- Set its population and date filters.
- Compare its detail records with a small expected sample.
- Save the report with a descriptive name, then add it to the dashboard.
The custom report builder supports multiple data sources and a sequence of source selection, fields, filters and visualization. Existing reports cannot simply be merged into one report; a combined result needs a new report with the relevant sources and configuration. Custom report builder.
Use a single-object deal report for a straightforward pipeline total. Add associated contacts or activities only when they answer a specific question. The reconciliation should still demonstrate the intended unit: one deal, one contact or one activity. A contact count placed beside a deal total does not establish a conversion rate unless the relationship and qualifying period are defined.
Dashboard Layout
In the dashboard, Add content then Report opens the report selection panel. Reports can be positioned by dragging them. HubSpot also provides report refresh from the report menu. Dashboard customization.
Put the main result first, a trend beneath it and an exception table nearby. Use the dashboard templates to plan that layout before building additional reports. A manager should be able to move from a changed total to the affected records without navigating through unrelated charts.
For a weekly pipeline meeting, a useful exception table includes the deal name, owner, amount, expected close date and next action. Keep the large total visible, but give the meeting an actionable work list.
Pipeline Reconciliation Example
Consider this hypothetical sample, with all amounts in USD and the same new-business pipeline. The requested dashboard measures open deals with Close date from 1 to 30 November 2026. The table combines stage and owner in one column for compact presentation; store them as separate properties in HubSpot.
| Deal | Stage and owner | Create date | Close date | Amount, USD |
|---|---|---|---|---|
| A | Open, Alex | 20 October | 20 November | 12,000 |
| B | Open, Sam | 5 November | 25 November | 8,000 |
| C | Won, Alex | 1 November | 10 November | 5,000 |
| D | Open, Sam | 10 November | 5 December | 7,000 |
| E | Open, unassigned | 12 November | 28 November | 3,000 |
The expected open pipeline is three deals worth $23,000: A, B and E. Alex owns $12,000, Sam owns $8,000 and $3,000 is unassigned. Include the unassigned bucket in the reconciliation; otherwise the visible owner groups would total only $20,000.
An open-deal report filtered by November Create date instead would contain B, D and E, worth $18,000. If both Create date and Close date must fall in November, only B and E remain, worth $11,000. These totals answer different questions. None should be accepted merely because its chart looks plausible.
Save the included deal IDs with the expected total. When a number changes, compare membership first, then amounts. That distinguishes a new deal entering the population from an existing deal changing value. It also exposes whether a missing owner has been silently excluded.
The example uses fixed dates so it can be repeated. A live dashboard can use a relative period, but its acceptance record should capture the actual dates resolved at the time of review. Keep the account time zone alongside the period definition when boundary times matter.
Filter Behavior
Dashboard filters operate on compatible report data sources. They generally add AND conditions, but a matching dashboard filter can override a simple report-level filter. Complex custom reports with grouped AND/OR filters keep the original logic and add the dashboard condition with AND. Inspect the applied conditions rather than assuming one rule covers every report. HubSpot dashboard filters.
For the pipeline example, label the control Close date. A generic Date label leaves the reader unable to tell whether they are changing creation, closing or another event. Test the control against A, which was created outside November but closes inside it, and D, which has the opposite pattern.
HubSpot's View & filter action on an individual report does not carry over dashboard-level filters. Additional dashboard filters can also persist in the current browser session. Record the viewing context when comparing two screenshots or a report against its dashboard. Filter scope and persistence.
Use a small acceptance matrix:
| View | Expected population | Expected amount, USD | Evidence |
|---|---|---|---|
| November Close date, all owners | A, B, E | 23,000 | Detail rows and applied filters |
| Same date, Alex only | A | 12,000 | Owner filter and deal ID |
| Same date, Sam only | B | 8,000 | Owner filter and deal ID |
| Same date, unassigned | E | 3,000 | Explicit empty-owner group |
Do not use a dashboard owner filter as an access control. A filter changes a view; the user's permissions govern their allowed operations and data. Test both independently.
Refresh and Distribution
Reports built with the custom report builder automatically refresh with newly available data every two hours; manual report or dashboard refresh is available once every 15 minutes. Treat those as report behavior, separate from the time an upstream integration delivered a change. Custom report refresh.
A practical freshness check records the source change time, HubSpot property update time and report observation time. If the source value never reached HubSpot, refreshing a chart will not repair it. If HubSpot contains the value but the report does not, inspect refresh, filters and associations next.
Recurring dashboard emails use the permissions of the user who set up the email. HubSpot advises each user to create their own recurring email when they should receive only their own data. Recurring dashboard emails go to HubSpot users; external one-off distribution has separate subscription and domain requirements. Dashboard sharing.
Review the exact recipient list and preview before enabling a schedule. Select the intended dashboard filter context rather than assuming the current screen will be reproduced. Give the schedule an owner who remains responsible when team membership changes.
HubSpot also states that report data for scheduled sharing is captured two hours before sending, and deleting a recurring email within that window may not stop the scheduled send. Include that lead time in an access-removal procedure. Scheduled report and dashboard delivery.
Reporting Diagnostics
Investigate a disagreement using one known record and one report before changing the whole dashboard.
| Symptom | First check | Evidence | Repair |
|---|---|---|---|
| Dashboard and report disagree | Viewing context and filters | Same deal IDs in both views | Align the intended period and conditions |
| Owner totals fall short | Empty or excluded owner values | Unassigned records | Add the exception bucket and repair ownership |
| Chart misses a recent change | Source value and report refresh | Property history and timestamps | Repair the delayed layer |
| Reader cannot see a tile | Report and data access | Restricted-user result | Grant the approved access at the relevant layer |
| Chart contains too many categories | Breakdown field | Distinct category count | Group categories or use a detail table |
Keep dashboard breakdowns below 100 values; use a detail table for longer lists. A customer name field with many distinct values can therefore be a poor chart breakdown even when it is useful in a table. Custom report breakdown limits.
When inconsistent values recur, use the CRM data hygiene audit skill to document the source and repair owner. For a separate warehouse or Microsoft reporting layer, the HubSpot Power BI integration guide covers extraction and modeling beyond the native dashboard.
Dashboard Acceptance Flow
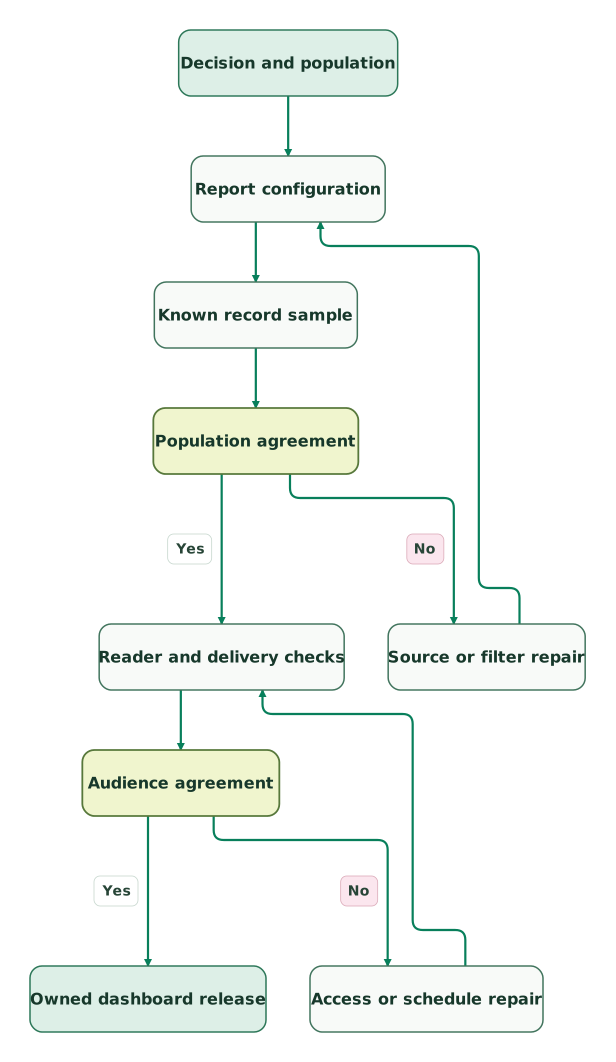
Read diagram as text
- Decision and population to Report configuration.
- Report configuration to Known record sample.
- Known record sample to Population agreement.
- Population agreement to Source or filter repair: No.
- Source or filter repair to Report configuration.
- Population agreement to Reader and delivery checks: Yes.
- Reader and delivery checks to Audience agreement.
- Audience agreement to Access or schedule repair: No.
- Access or schedule repair to Reader and delivery checks.
- Audience agreement to Owned dashboard release: Yes
Population repairs return to report configuration and repeat the record sample. Access or schedule repairs repeat the audience checks, including the delivery preview. A completed chart does not bypass either branch.
Dashboard Checklist
- A named meeting or workflow gives the dashboard a purpose.
- Every measure identifies its object, date property, unit and inclusion rules.
- Required report types and permissions are available in the account.
- Included record IDs reconcile to totals and owner groups.
- Unassigned and excluded records have an explicit treatment.
- Dashboard filters have been checked on every affected report.
- A restricted reader sees the intended reports and records.
- Refresh expectations distinguish source delivery from report processing.
- Scheduled recipients, owner and filter context have been reviewed.
- A named operator owns discrepancies and the next review date.
Keep reading
Browse all CRM & Lifecycle guides
 CRM & Lifecycle
HubSpot implementation: a phased plan, template and launch checklist
Implement HubSpot in five phases: scope, data model, migration, integrations and launch. Includes a plan template, a worked example and a go-live checklist.
Jafrin Akter AloLast updated 22 min read
 Data Warehouse
HubSpot Power BI Integration: Build Pipeline Reports That Reconcile
Connect HubSpot to Power BI with correct deal grain, stage history, currency and refresh. Test duplicate joins, old-deal updates and restricted-reader access.
Jafrin Akter AloLast updated 12 min read
 CRM & Lifecycle
CRM Property Ownership: Stop Integrations Overwriting Good Data
Stop CRM integrations overwriting useful data with property-level ownership, explicit blank rules and stable matching. Includes a renewal-field contract and tests.
Jafrin Akter AloLast updated 10 min read
CRM & marketing automation
See the implementation scope, deliverables and acceptance checks.
Questions people ask
Can one HubSpot dashboard serve both sales managers and individual representatives?
Yes, provided the measures and access model work for both audiences. Check representative views using the actual restricted role, and keep manager-only information appropriately controlled. Separate dashboards are often easier to maintain when the meetings need different decisions. A personal owner filter can make a view convenient, but it does not replace data permissions.
Should the first HubSpot dashboard include every stage conversion rate?
No. Start with the measures whose populations and dates the team can explain. Stage conversion requires an agreed cohort, qualifying transitions and observation window. Adding a percentage before those decisions creates an apparently precise number with an unclear meaning. Build a small conversion sample separately, then add the measure after its record membership has been reconciled.
Is a blank dashboard safer than a HubSpot template?
A blank dashboard offers more deliberate scope, while a template can shorten setup when its reports match the team's process. Neither guarantees correct reporting. Inspect the fields, date properties and inclusion rules of every retained report. Prefer the starting point that needs fewer unexplained assumptions, then validate it against records the business owner understands.
Can an exported dashboard replace an operational exception list?
An exported dashboard is useful for a fixed review, but an operational list needs current records, ownership and a place to record follow-up. Keep the export's period and filter context visible. For daily work, provide a route from the measure to the affected records so the team can resolve exceptions and verify that they leave the list.
What should happen when a dashboard owner leaves the company?
Assign a replacement for the dashboard and its distribution schedules before removing the former owner's access. Review recipients, saved filters, report permissions and the definition of each measure. Recheck a representative result under the replacement owner. Include the dashboard in the team's operating inventory so future changes have an accountable person and a review date.
Sources

Written by
Jafrin Akter AloData Engineer and Co-founder at Martechdevs and Growth and Analytics Partners
Jafrin writes practical guides to marketing technology, customer data, analytics and AI workflows. Martechdevs is a Growth and Analytics Partners company.