
GA4 Bounce Rate: Definition, Report Setup and Useful Benchmarks
GA4 bounce rate is the percentage of sessions that did not qualify as engaged. With the default timer, a session is engaged if it lasts longer than ten seconds, contains a qualifying key event, or records at least two page or screen views. Bounce rate is therefore 100% minus engagement rate. A visitor can read one page and leave without bouncing.
On this page
GA4 bounce rate and engaged sessions
Any one of the three conditions qualifies a session; the examples assume correct collection and the default timer. Google's engagement definition.
| Illustrative session | Page views | Qualifying key event | Engaged session |
|---|---|---|---|
| Five-second visit with no outcome | 1 | No | No |
| Forty-five seconds of recorded reading | 1 | No | Yes, by time |
| Confirmed lead submitted after six seconds | 1 | Yes | Yes, by outcome |
| Two genuine pages viewed within eight seconds | 2 | No | Yes, by views |
The first session contributes to bounce rate. The others contribute to engagement rate once each, even if they meet several conditions. A click, scroll or other ordinary event does not automatically qualify as a key event. Keep the distinction between a collected interaction and a designated business outcome clear in your GA4 key-event setup.
Google excludes first_visit, first_open and session_start from engagement qualification even when marked as key events. Engagement exceptions. Marking those events cannot turn every arrival into an engaged session.
The ten-second threshold is configurable for web streams. The Google tag's Adjust session timeout settings contain both the inactivity timeout and the separate timer for engaged sessions. Record the actual engagement threshold before comparing properties. Google tag settings.
In our analytics and tracking work, the first question is what a successful visit should accomplish. A recipe reader, a pricing-page visitor and an existing customer looking up an address have different jobs. The engagement definition provides a consistent measure within a configuration; it does not decide whether the page helped its audience.

Bounce-rate formula and worked example
Calculate bounce rate from non-engaged sessions divided by all sessions in the same reporting population. Equivalently, subtract engaged sessions from sessions before dividing.
Bounce rate = (sessions - engaged sessions) / sessions × 100
Engagement rate = engaged sessions / sessions × 100
Suppose a fictional landing page receives 800 sessions, of which 520 are engaged. That leaves 280 non-engaged sessions. Its bounce rate is 280 / 800 × 100 = 35%; engagement rate is 65%. Use sessions as the denominator, rather than users, views or event count. Google's metric definitions.
For a spreadsheet with Sessions in B2 and Engaged sessions in C2, this formula returns a fraction for percentage formatting. It leaves an empty or zero-session row blank and rejects impossible counts:
=IF(OR(B2="",C2=""),"",IF(OR(B2<0,C2<0,C2>B2),NA(),IF(B2=0,"",(B2-C2)/B2)))For the example, the result is 0.35, displayed as 35%. A blank result means there is no usable session denominator. It should not become a zero-bounce claim. Confirm that imported counts are numeric before applying the formula.
Combined traffic and weighted rates
A combined rate must use combined counts. In this fictional dataset, the two rows are mutually exclusive groups covering the whole population:
| Traffic group | Sessions | Non-engaged sessions | Bounce rate |
|---|---|---|---|
| Existing demand | 900 | 270 | 30% |
| New prospecting | 100 | 70 | 70% |
| Combined | 1,000 | 340 | 34% |
Averaging the two percentages gives 50%, which gives the small group as much influence as the large one. The actual combined result is 340 / 1000 = 34%. For repeated reporting, retain session counts beside the rate so another analyst can reproduce it.
When the share of prospecting traffic increases, the overall rate can rise while each group's behavior stays unchanged. That is a reason to inspect acquisition composition before rewriting the page. The GA4 bounce-rate troubleshooting guide covers that diagnosis, duplicate page views and unexpected changes in detail.
Bounce rate in GA4 reports
Add Bounce rate to a detail report, then place Sessions and Engaged sessions beside it. An Editor or Administrator can open Customize report > Metrics > Add metric, select Bounce rate and Engagement rate, apply the change and save. If the options only offer cards, you are editing an overview rather than a detail report. Google's report customization instructions.
For a landing-page decision, start with Reports > Engagement > Landing page where that collection is available. The Landing page dimension uses the first pageview's path and query string in the session. A customized navigation can place the report elsewhere; an Editor can restore it through the report library. Landing page report.
Use this review sequence:
- Select a completed reporting period and the intended property.
- Select the landing page or a meaningful group of entry pages.
- Add the session counts and bounce rate.
- Compare a relevant acquisition dimension, such as session source and medium, within that landing-page population.
- Inspect device differences and the relevant business outcome before choosing a change.
- Save the report configuration with the decision, so the next comparison measures the same population.
A report about every page viewed during a session answers a different question from a report about the page where the session started. Use the entry-page population when assessing whether an ad's destination or search landing page meets the promise that brought someone there.
The Traffic acquisition report is useful when the main question concerns channels. Use session-scoped dimensions for session acquisition; a first-user dimension describes initial acquisition and can group returning sessions differently. Traffic acquisition report.
Recorded engagement time
A browser tab being open does not establish active reading. Google records user engagement when a web page has focus or an app is in the foreground, and passes elapsed engagement time with collected events. User engagement measurement.
For a practical check, compare a short departure with a longer foreground visit. Preserve the consent setup and inspect the actual measurement. If the report seems implausible, use the GA4 audit checklist before treating the percentage as a design verdict.
GA4 bounce rate versus Universal Analytics
Universal Analytics used a single-page, single-request session definition for a bounce. GA4 uses engagement qualification. That change breaks direct comparisons between the old and current percentages, even when the website and its audience stay the same. Google's legacy UA definition.
| Situation | Universal Analytics interpretation | GA4 interpretation |
|---|---|---|
| Long reading session with one initial tracked request | Could be a bounce with zero reported duration | Can qualify as engaged through recorded time |
| Short session with a qualifying tracked business outcome | Depends on the interaction-hit setup | Qualifies through the key event |
| Two genuine tracked page views | Generally outside the single-request bounce definition | Qualifies through the view condition |
| Same percentage before and after migration | Uses the old collection and hit rules | Uses the new engagement rules |
A historical target such as “keep bounce below 50%” needs a fresh definition before being reused. Retain the old measure for historical context, but establish a GA4 baseline from comparable traffic, collection and settings. A lower number after migration does not prove the new website converts better.
Bounce rate and exits
An exit identifies the page or screen where the last event in a session occurred. A bounce classifies a session's engagement. A customer can complete a purchase, read confirmation and exit during an engaged session. Google's entrance and exit definitions.
Use exits when investigating where journeys finish, and bounce rate when assessing the share that failed the engagement criteria. Neither metric alone establishes abandonment. A completed booking and a broken payment can both end a session; their business outcomes distinguish them.
GA4 bounce-rate benchmarks with comparable definitions
Use benchmarks as context for a comparable audience, not as a universal target. These publishers report their own datasets; the figures do not represent every website.
| Published dataset | Reported measure | Bounce-rate reference | Scope |
|---|---|---|---|
| Littledata Shopify cohort | Median bounce rate | 43% | 449 stores, a 90-day GA4 sample |
| Siege Media, all sites | Median engagement rate of 51% | 49%, calculated as 100% minus 51% | 546 GA4 properties |
| Siege Media, ecommerce and retail | Median engagement rate of 54.4% | 45.6%, calculated | Industry subset of that study |
| Siege Media, SaaS and B2B software | Median engagement rate of 46.6% | 53.4%, calculated | Industry subset of that study |
Sources: Littledata's bounce-rate benchmark and Siege Media's engagement-rate study. The converted figures are arithmetic equivalents of the reported engagement medians, rather than a separate measurement we collected.
Littledata includes connected Shopify properties meeting minimum traffic and purchase requirements, including at least 1,000 sessions and 90 purchases in the measured period. Its cohort therefore excludes many new or very small stores. Its sector medians range from 37% for beauty and skincare to 46% for food and beverage. Those figures are useful context for similar stores, with the source's population and collection method kept visible.
Siege Media covers several industries and a different observation window. Its industry groups contain at least ten properties, use a client-level median and exclude staging, test and app streams as well as statistical anomalies. A broad benchmark is a starting reference; its aggregate cannot tell you the expected rate for one specific search-intent or paid-social landing page.
Do not average these studies into a synthetic “industry standard.” Different samples, time windows and configurations contribute different evidence. Choose the closest population and compare your own like-for-like history alongside it.
GA4 peer-group benchmarks
GA4 also offers benchmarking for supported metrics, with the peer-group median and the 25th-to-75th-percentile range. Availability depends on eligibility, the selected metric and the Modeling contributions & business insights account setting. Review that data-sharing choice with the account owner before changing it. Google's benchmarking guide.
Open an eligible metric card's benchmarking badge and inspect the peer group. A comparison with a different industry can be technically available and commercially irrelevant. Keep the chosen group in the report notes, and use the range to frame an investigation rather than turn its median into a pass/fail line.
A useful bounce-rate improvement decision
Improve the visitor's outcome, then use bounce rate as supporting evidence. Start with a landing page that has enough relevant traffic to matter and a clear intended next step. A low-volume page with an extreme percentage can absorb attention while a high-volume failure remains untouched.
For example, imagine two fictional paid campaigns with 1,000 sessions each. Campaign A has a 30% bounce rate and ten qualified enquiries; Campaign B has a 50% bounce rate and thirty qualified enquiries. Before cutting B, compare acquisition cost, customer fit and the subsequent sales outcome. Bounce rate alone prefers A, while qualified demand points toward a different decision.
A useful action follows the observed gap:
| Evidence | Investigation | Success measure |
|---|---|---|
| Ad promises a specific service; landing page stays generic | Message and destination fit | Qualified enquiries from that traffic |
| Mobile visitors struggle with the form | Actual task completion on that device | Successful submissions and error rate |
| Readers find the answer but cannot locate the next relevant step | Navigation and link usefulness | Appropriate onward actions |
| Rate changes after a tag or configuration release | Measurement definition and collected events | Reconciled known journeys |
Do not create an automatic key event just to lower bounce rate. It can make the metric attractive while leaving the customer's problem unchanged. Define useful outcomes through the GA4 key-event guide, then use a controlled test when there is a real content or journey hypothesis.
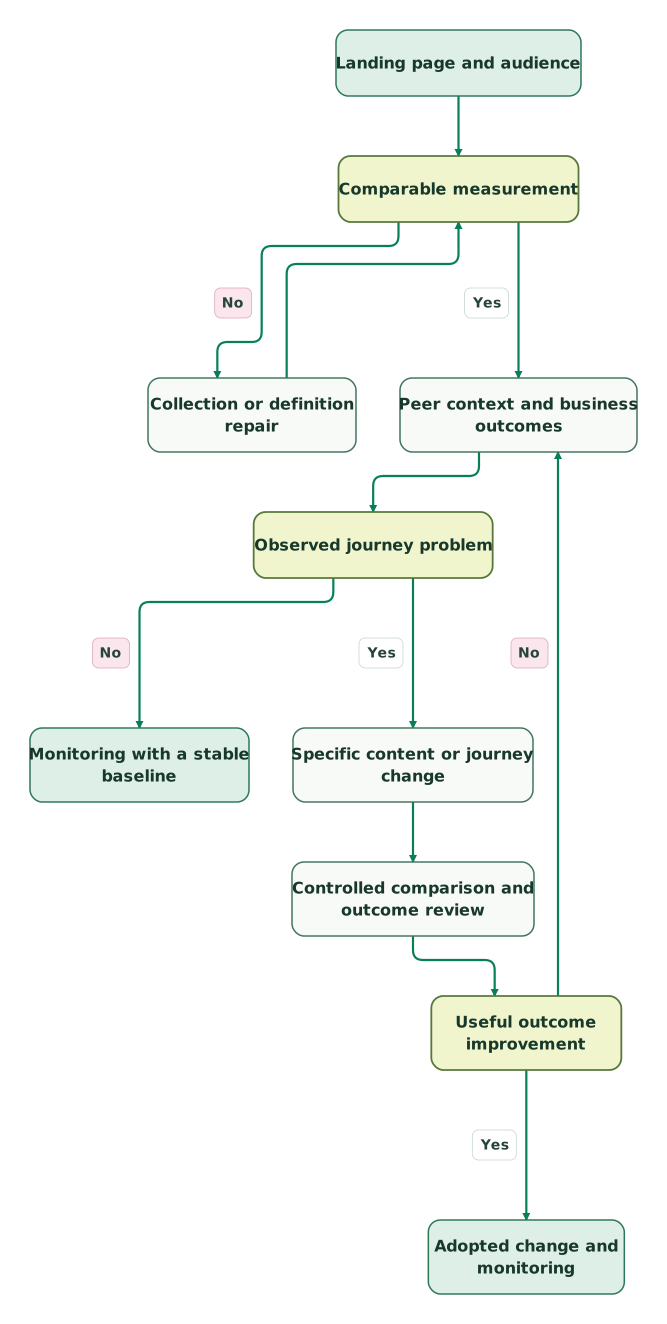
Read diagram as text
- Landing page and audience to Comparable measurement.
- Comparable measurement to Collection or definition repair: No.
- Collection or definition repair to Comparable measurement.
- Comparable measurement to Peer context and business outcomes: Yes.
- Peer context and business outcomes to Observed journey problem.
- Observed journey problem to Monitoring with a stable baseline: No.
- Observed journey problem to Specific content or journey change: Yes.
- Specific content or journey change to Controlled comparison and outcome review.
- Controlled comparison and outcome review to Useful outcome improvement.
- Useful outcome improvement to Adopted change and monitoring: Yes.
- Useful outcome improvement to Peer context and business outcomes: No
The correction path returns to the evidence. A change that lowers bounce but harms qualified outcomes should not become the new default merely because it crossed a benchmark.
Bounce-rate reporting checklist
- The report uses GA4's engagement definition and the actual web-stream timer.
- Sessions, engaged sessions and bounce rate describe the same population.
- The selected dimension matches the acquisition or landing-page question.
- Combined rates are calculated from counts rather than averaged percentages.
- A benchmark has a named source, stated population and matching metric definition.
- UA-era comparisons remain separate from the GA4 baseline.
- A proposed change has a customer outcome beyond a lower percentage.
- Known short, long, two-page and successful-action journeys behave as intended.
Use the GA4 audit skill for collection checks and the bounce-rate troubleshooting guide for an unexpected jump or collapse. Our GA4 implementation service covers the event setup, report definitions and acceptance checks when the team needs help establishing that baseline.
Keep reading
Browse all Tracking & Attribution guides
 Tracking & Attribution
GA4 setup for SaaS and apps: the events and settings that matter
Set up GA4 for a SaaS acquisition journey. Define events, test consent and cross-domain tracking, choose Ads goals and verify revenue, identity and export.
Jafrin Akter AloLast updated 14 min read
 Tracking & Attribution
GA4 Bounce Rate Looks Wrong? 5 Checks Before You Change the Page
Diagnose unexpected GA4 bounce rates. Check duplicate views, key events, engagement timers, session scope and weighted averages before changing your page.
Jafrin Akter AloLast updated 10 min read
 Tracking & Attribution
Google Analytics API: Reports, Configuration and Event Collection
Choose the GA4 Data API, Admin API or Measurement Protocol. Run a report, configure access, paginate results and plan quotas with practical examples.
Jafrin Akter AloLast updated 10 min read
Analytics & tracking
See the implementation scope, deliverables and acceptance checks.
Questions people ask
Can a one-page reader avoid being counted as a GA4 bounce?
Yes. A single-page visit can qualify through recorded time or a qualifying key event, even without a second page view. A reader who finds a complete answer may therefore have an engaged session and leave satisfied. Judge that page against its intended job and useful next actions instead of requiring extra navigation to make the visit look successful.
Should a team lower its engagement timer to beat a bounce-rate benchmark?
Changing the timer changes the measurement definition. It does not establish that visitors found more value. Choose a threshold that fits the reporting purpose, document it and keep comparisons consistent. If the team deliberately changes that definition, create a new baseline and assess the customer outcome separately from the resulting percentage shift.
Does a high exit count imply a high GA4 bounce rate?
No. Exits identify where sessions end, while bounce rate concerns whether those sessions qualified as engaged. A purchase confirmation can have many exits after successful, engaged visits. Inspect the completed or failed task behind the exit before treating it as a problem, and keep page-level counts separate from a session-based rate.
Can a Shopify bounce benchmark set a target for a B2B demo page?
It can provide broad context, but it is a weak direct target. Shopify shoppers and B2B demo prospects have different intentions, journeys and success conditions. Use a relevant peer group where available, then compare the demo page's own audience segments, qualified submissions and sales outcomes under a consistent measurement setup before deciding what needs improvement.
How should a zero-session row appear in a bounce-rate report?
Show it as unavailable or blank, with the zero session count visible. The rate has no usable denominator, so displaying 0% implies an engagement result that was never observed. Check whether the empty row comes from the chosen filters, dates or collection before interpreting it. Keep that case distinct from measured sessions with no bounces.
Sources
- Google: Engagement rate and bounce rate
- Google: Configure Google tag settings
- Google: Landing page report
- Google: Traffic acquisition report
- Google: User engagement
- Google: Legacy Universal Analytics bounce rate
- Google: Entrances and exits
- Littledata: Ecommerce bounce-rate benchmarks
- Siege Media: GA4 engagement-rate benchmarks
- Google: Analytics benchmarking

Written by
Jafrin Akter AloData Engineer and Co-founder at Martechdevs and Growth and Analytics Partners
Jafrin writes practical guides to marketing technology, customer data, analytics and AI workflows. Martechdevs is a Growth and Analytics Partners company.