
Experimentation Platforms: 8 Options Compared by Metrics, Limits and Test Readiness
Choose an experimentation platform by where your decision metrics live, how the product assigns a consistent experience, and whether your traffic can answer the question in time. Analytics-native tools suit established product events; warehouse-native tools suit maintained business tables. Existing feature flags can feed a separate analysis platform. Verify result access, exposure definitions and quota behavior before treating any free plan as sufficient.
On this page
A platform can assign variants correctly while analyzing the wrong population. It can also keep serving a test after its reporting allowance runs out. The purchase needs to cover the whole path from assignment to a defensible decision.
Martechdevs provides implementation services. Our recommendations below follow the operating requirements: a team should be able to reproduce its first result, explain the denominator and keep the workflow working after trial access ends.
Which experimentation platform fits your team?
Start with the metric and operator, then compare two candidates that can complete the same test. The product analytics tools guide covers broader analytics selection; this guide focuses on assignment, experiment analysis and release decisions.
| Team and starting position | First candidate | Runner-up | Why start here | Weaker fit and why |
|---|---|---|---|---|
| Small product team with reliable Mixpanel or Amplitude events | The existing tool's experiment product | The other analytics-native option | Reuse metrics and analysis ownership | A second data platform adds work unless it solves an actual limitation |
| Engineering-led startup combining release investigation, flags and replay | PostHog | Statsig Cloud | Keep implementation and investigation close | Warehouse-native analysis is harder to justify without maintained business tables |
| Data team already owns revenue and product metrics in a warehouse | GrowthBook | Statsig Warehouse Native | Build on those maintained definitions | Copying the same data into another analytics store adds reconciliation work |
| Product and engineering need business outcomes plus performance guardrails | Datadog Experiments | Statsig | Evaluate the business and technical effects of a release together | A narrow conversion-only workflow may leave performance investigation disconnected |
| Engineering already operates LaunchDarkly | LaunchDarkly experimentation | GrowthBook using existing assignment data | Preserve the delivery owner and release workflow | Replacing flag infrastructure solely for a reporting preference creates migration work |
| Growth team already runs an Optimizely program | Optimizely with warehouse-native Analytics | GrowthBook | Extend the existing experiment and analysis workflow | A new bundled suite is harder to justify for one small isolated test |
These are starting recommendations, not a universal ranking. If the team cannot produce a stable activation denominator, switching experiment engines will not fix that. First define the activation outcome you want to improve, its unit and its observation window.
What must the platform do before its statistics matter?
It must assign consistently, record the relevant exposure, join outcomes to the correct unit, preserve nonconverters and let the owner inspect failures. A mathematically sound test cannot repair a broken join.
Use these requirements in the evaluation.
| Requirement | Meaning | Evidence to request |
|---|---|---|
| Assignment | Which variant a user or account is allocated to | Stable assignment across refreshes, devices and the relevant account boundary |
| Exposure | When the change can actually affect the unit | Matching control and treatment logging at the intended decision point |
| Metric definition | The outcome, population and observation window | Reproducible inputs including zero-outcome units and late records |
| Statistical method | How uncertainty and the stopping rule are handled | The selected engine, assumptions and decision threshold |
| Diagnostics and control | How invalid data or harmful behavior is detected | Allocation checks, guardrails, pause/rollback and ownership |
For an onboarding experiment, do not emit exposure for every login if the feature appears only at a later setup step. Conversely, do not log exposure only when someone clicks the new button: treatment has already influenced who enters that group. Make the trigger observable under both variants, or use the appropriate assignment-based analysis.
A B2B workspace feature may need account-level randomization and account-level metrics. Ten teammates do not provide ten independent accounts. Anonymous-to-known identity changes, shared devices and account switches belong in the acceptance test, not in an analyst’s explanation after the chart looks strange.
Our experiment instrumentation and validation service connects those definitions with the application and reporting implementation. Agree on them before adding more SDK events.
How do the eight options compare on access and cost?
Compare the specific analysis path and the allowance it consumes. Monthly experiment users, metered events, flag requests and editor seats are not interchangeable.
The allowances below are monthly unless stated otherwise. USD prices describe the indicated product scope, before other applicable charges.
| Platform | Entry allowance or commercial basis | Important limit | Where to verify |
|---|---|---|---|
| Amplitude | Free: one active feature experiment and one web experiment | Free and Plus exclude experiment results | Plan comparison |
| Mixpanel | Free: 1,000 MEU; Growth: 5,000 included MEU | Active-flag limits and experiment usage are separate | Pricing |
| PostHog | One million free flag requests; experiments billed with flags | Analytics, replay and synced rows have separate meters | Pricing |
| Statsig Cloud | Developer: two million events; Pro: USD 150 with five million events | Pro adds USD 0.05 per extra 1,000 metered events | Pricing |
| GrowthBook Cloud | Starter: three users, one project; Pro: USD 40 per seat monthly | Managed-warehouse and CDN usage have their own limits | Pricing |
| LaunchDarkly | Developer: 100,000 experimentation MAU | Also limited to 1,000 client-side MAU and five service connections | Pricing |
| Datadog Experiments | From USD 450 per launched experiment/month, billed annually; USD 575 on-demand | Billable once launched with at least 500 subjects and three days of data | Experiments pricing |
| Optimizely | Free Rollouts supports one concurrent experiment; quote the broader package | Warehouse-native Analytics is a separate scope to confirm | Rollouts FAQ |
When does Amplitude make sense?
- Best for: Product teams that already trust their Amplitude events and metric definitions.
- Pros: Reusing the existing behavioral model can reduce implementation and reconciliation work.
- Cons: Free and Plus exclude experiment results and feature A/B/n testing, even though they allow limited active experiments. Confirm the retained plan's analysis access. Amplitude plan comparison
- Free tier and startup offer: The Startup Plan offers 12 months of Growth to eligible companies with fewer than 20 employees and less than USD 10 million raised. A usage-based year-two quote arrives before expiry; confirm the experiment entitlements you will retain.
- Choose it if: The decision-maker can explain a known activation difference using the same events and the production plan covers that workflow.
- Skip it if: Required results depend on trial access that the team cannot afford to keep.
Run that evaluation using a real metric definition and a controlled set of records. The Mixpanel versus Amplitude comparison covers the broader data workflow.
When does Mixpanel make sense?
- Best for: Product teams whose experiment outcomes and analysis owner already live in Mixpanel.
- Pros: Experiments can use external flag exposure events. The conventional event is
$experiment_started, with string experiment and variant names. Sequential, frequentist and open-beta Bayesian methods are available. Mixpanel experiments - Cons: Free stops experiment creation, editing, viewing and new results at its allowance while flags continue serving. Growth uses overages. Above an average of 30 exposure events per MEU, usage is calculated as total exposures divided by 30. Experiment usage rules
- Free tier and startup offer: Regular Free includes 1,000 MEU/month. The startup program lasts 12 months and includes 1.2 million MEU per year. Applicants must be under five years old, have raised no more than USD 8 million, have never held a paid Mixpanel plan, and have not redeemed another Mixpanel offer. Start sending data within 90 days of acceptance. Price the retained Growth or Enterprise plan before the annual allowance or program ends.
- Choose it if: You can connect actual exposure to existing product outcomes and reproduce the experiment population.
- Skip it if: Results must remain continuously available but you cannot fund the required experiment allowance.
Log exposure at the point where the change can affect the customer. Confirm that the chosen statistical method supports the intended metric configuration before committing to it.
When does PostHog make sense?
- Best for: Engineering-led teams that want release investigation, product analytics and replay within one workflow.
- Pros: Supports Bayesian analysis, frequentist analysis with optional sequential testing, and warehouse-sourced experiment metrics.
- Cons: Selected warehouse data is copied into PostHog and queried on its compute. Free or configured billing limits can drop excess events and cause flags to return a default quota-limited response. Data architecture, quota behavior
- Free tier and startup offer: Regular allowances include one million flag requests/month. The startup program offers USD 50,000 in credits for 12 months to eligible companies under two years old with less than USD 5 million raised, subject to account and company-email requirements. Plan for normal usage charges beyond free allowances when credits expire or run out; service calls are excluded from credits.
- Choose it if: Engineers own the identity joins, exposure implementation and response when a product reaches its limit.
- Skip it if: Your architecture requires experiment queries to run entirely inside your existing warehouse.
Validate timestamps and identity joins for external metrics. A successful sync does not establish that an outcome belongs to the correct variant or observation window.
When does Statsig make sense?
- Best for: Teams choosing either an integrated cloud experiment workflow or enterprise analysis on maintained warehouse data.
- Pros: Warehouse Native can analyze assignments from Statsig or another system inside the warehouse. Warehouse Native architecture
- Cons: Warehouse Native requires an Enterprise arrangement. Cloud metering includes qualifying exposure and logged events; exceeding Developer's allowance stops Metric Lift while targeting continues. Deployment scope, metering and limits
- Free tier and startup offer: Developer includes two million metered events/month. The startup program offers 12 months of Enterprise features and one billion events to eligible companies under five years old with less than USD 50 million in funding. Confirm the accepted deployment scope. After the program, select Free, Pro or Enterprise against actual usage.
- Choose it if: An owner can reconcile assignments, metric inputs and the chosen deployment's costs.
- Skip it if: The buying case assumes Cloud allowances also cover the warehouse contract or that unlimited flag checks make exposures unmetered.
Amplitude's strategic partnership announcement says it takes on the Statsig brand and customers and maintains the cloud and warehouse platform. Confirm the actual product, contract and support arrangement; this does not establish that Amplitude and Statsig plans have merged.
When does GrowthBook make sense?
- Best for: Teams with a data owner who can maintain assignment tables and business metrics.
- Pros: Cloud Starter supports unlimited flags and experiments within its user and project allowances; bring-your-own and managed warehouse paths are distinct options. GrowthBook plans
- Cons: Include editors, permissions, compute and delivery costs. The managed warehouse includes one million events on Starter and two million on Pro, then USD 30 per extra million on Pro. Warehouse limits
- Free tier and startup offer: Use the standard three-user, one-project Starter plan for a small initial team. The baseline budget here assumes no promotional credit; Pro starts at USD 40 per seat/month. Plan limits and prices
- Choose it if: You can inspect query inputs and maintain the metric definitions behind each decision.
- Skip it if: Nobody will own data modeling and refresh failures after the initial setup.
Test the retained tier with the actual permissions and metric you need. An unlimited experiment count says little about whether your operating process is ready.
When does LaunchDarkly make sense?
- Best for: Engineering teams that already operate LaunchDarkly's feature-delivery and release controls.
- Pros: Evaluate experimentation within the established release workflow before introducing another delivery system.
- Cons: The Developer allowance combines separate meters: 100,000 experimentation MAU, 1,000 client-side MAU and five service connections. A connection is a server-side SDK connected to one environment for a month. LaunchDarkly limits
- Free tier and startup offer: Developer is the standard free starting point. Budget its published limits without assuming a startup award; price the flag-serving capacity as well as experiment usage.
- Choose it if: The release owner can operate the required plan and expose trustworthy business outcomes to the analysis.
- Skip it if: The budget assumes the experiment-user allowance also covers every browser user receiving flags.
For a hypothetical product with 20,000 browser users and 5,000 experiment participants, those populations cross different limits. Forecast the entire flag-delivery path before accepting a quote.
When does Datadog Experiments make sense?
Datadog rebuilt Eppo's experimentation capabilities as Datadog Experiments and feature management as Datadog Feature Flags. Evaluate the current product scope when replacing an older Eppo comparison or contract assumption. Datadog product architecture
- Best for: Teams evaluating business outcomes alongside application-performance guardrails.
- Pros: Use Datadog flags end to end or connect your own flagging system through warehouse-native experimentation. RUM or Product Analytics can add performance and behavioral context. Experiments product FAQ
- Cons: Cost scales with billable launched experiments. The listed package includes one million monthly flag configuration requests per experiment purchased; data-source and additional-product costs still need scoping. Included usage
- Free tier and startup offer: Experiments offers a trial. Datadog for Startups advertises up to USD 100,000 in first-year credits for qualifying new customers at Series A or earlier through a partner referral. The acceptance notice defines the award and eligible services. Credits end at exhaustion, the program end or removal; normal fees then apply. Program terms
- Choose it if: An owner can reproduce a warehouse business metric and connect it to the relevant release guardrails.
- Skip it if: A narrow test has no need for that workflow and the per-experiment price outweighs the operational benefit.
The 500-subject and three-day billing trigger is a commercial rule. It does not establish adequate statistical power or a mature outcome window. A test can become billable while still being too small to answer its question. Billing threshold
When does Optimizely make sense?
- Best for: Teams extending an existing Optimizely experimentation program into maintained business data.
- Pros: NetSpring is now Optimizely Warehouse-native Analytics, providing a route to warehouse-based business analysis alongside experimentation. Current product mapping
- Cons: Verify the exact assignment product, Analytics package, integration and permissions. An Analytics entitlement alone does not establish that every experiment-delivery product is included.
- Free tier and startup offer: Rollouts is available free to companies of any size, with unlimited feature flags and one concurrent experiment. This is a standard entry plan; evaluate the paid experimentation and Analytics scope separately. Rollouts and Feature Experimentation FAQ
- Choose it if: The existing program and data owner can deliver one reproducible business result with the proposed package.
- Skip it if: The initial case depends on a larger bundled purchase before one useful experiment has been defined.
For both the Datadog and Optimizely routes, retain a concrete metric, permissions, refresh timing, a cost estimate and an operating owner in the evaluation. Product renaming does not automatically migrate an integration or contract.
Can your traffic detect the improvement that matters?
Estimate the required sample before choosing a tool around an experiment you cannot finish. The minimum detectable effect is the change large enough to justify the decision, not the smallest number a calculator accepts.
Suppose a hypothetical product has 1,500 new eligible, independent users each week. Its baseline activation rate is 20%. For a two-variant, equally allocated, fixed-horizon binary-outcome test, use a two-sided 5% significance level and 80% planning power.
An approximate per-variant sample size is:
n = [zα × √(2p̄(1 − p̄)) + zpower × √(p₁(1 − p₁) + p₂(1 − p₂))]² ÷ (p₂ − p₁)².
Here p̄ is the average of the two assumed rates, zα is approximately 1.96 and zpower approximately 0.842. This normal approximation uses a pooled null variance and an alternative variance; R’s power.prop.test documents the same two-sample planning problem and its source exposes the power equation. R power calculation reference, R implementation
The resulting planning estimates are:
| Assumed rates | Minimum effect | Users per variant | Total users | Recruitment time at 1,500/week |
|---|---|---|---|---|
| 20% to 22% | 2 percentage points; 10% relative | 6,510 | 13,020 | 8.68 weeks |
| 20% to 25% | 5 percentage points; 25% relative | 1,094 | 2,188 | 1.46 weeks |
Recruitment time is not a final reporting date. With a seven-day activation outcome, allow the last enrolled users their full window, plus applicable late-data processing. Respect relevant business cycles and novelty effects. Clustered accounts, repeated observations, revenue distributions, many variants and sequential designs need their own planning method.
The following standard-library Python reproduces the approximate binary-outcome calculation. Rates are fractions: enter 0.20, not 20. It is a planning helper, not an experiment-analysis engine.
from math import ceil, isfinite, sqrt
from statistics import NormalDist

def users_per_variant(baseline, target, alpha=0.05, power=0.80):
    inputs = (baseline, target, alpha, power)
    if any(isinstance(x, bool) or not isinstance(x, (int, float))
           or not isfinite(x) for x in inputs):
        raise ValueError("Use finite numeric probabilities")
    if not (0 < baseline < 1 and 0 < target < 1):
        raise ValueError("Rates must be strictly between zero and one")
    if baseline == target:
        raise ValueError("Choose a nonzero detectable effect")
    if not (0 < alpha < 1 and 0.5 < power < 1):
        raise ValueError("Use alpha in (0, 1) and power in (0.5, 1)")
    normal = NormalDist()
    pooled = (baseline + target) / 2
    null_sd = sqrt(2 * pooled * (1 - pooled))
    alternative_sd = sqrt(
        baseline * (1 - baseline) + target * (1 - target)
    )
    numerator = (normal.inv_cdf(1 - alpha / 2) * null_sd
                 + normal.inv_cdf(power) * alternative_sd)
    return ceil((numerator / abs(target - baseline)) ** 2)

print(users_per_variant(0.20, 0.22))  # 6510
print(users_per_variant(0.20, 0.25))  # 1094
Do not interpret 80% power as an 80% probability that a significant result is true. It is a planning probability of detection under the assumed effect and method. A smaller study may still produce a result, but it has less ability to distinguish the proposed effect from noise.
When the feasible sample is too small, change the question or learning method. Test a larger meaningful intervention, investigate a higher-volume step when it answers the real question, or use interviews and observed usability failures to improve the design. Do not raise the expected lift solely to make the timeline look acceptable.
How should you compare statistical engines and outcome explanations?
Choose a method your team can operate with a predefined decision rule. A “Bayesian” label is not permission to ignore sample size, and “frequentist” does not tell you whether repeated looks are valid.
| Term | Practical meaning | Buying question |
|---|---|---|
| Fixed horizon | Evaluate using a predetermined analysis point | Can the team avoid shipping on an early favorable fluctuation? |
| Sequential method | Inference designed for repeated looks under its assumptions | Is it enabled for this experiment and metric? |
| Bayesian analysis | Update an effect distribution using a model and prior | What prior, likelihood and decision threshold are used? |
| CUPED | Use suitable pre-experiment information to reduce outcome variance | Does this metric and population have useful prior behavior? |
| Guardrail | Outcome that must not deteriorate beyond an agreed boundary | What happens when the primary metric wins but safety or customer experience fails? |
PostHog’s frequentist documentation distinguishes fixed-horizon testing from its optional sequential mode. Inspect that actual setting before using early stopping. Frequentist and sequential configuration
CUPED needs informative pre-experiment behavior. PostHog applies it to mean metrics except those using outcome thresholds or session properties, and to ordered funnels without data-warehouse steps. Ratio, retention, unordered-funnel and warehouse-funnel metrics remain unadjusted. Confirm the exact metric type before assuming a variance-reduction setting will shorten your test. PostHog CUPED scope
For interpretation, ask the trial owner to explain the overall result, the relevant funnel and the predeclared guardrails. Replay can expose a broken interface, but several recordings do not measure how common the problem is. A favorable segment discovered after many comparisons is a follow-up hypothesis. Preserve the original decision metric and make multiplicity handling explicit.
How do you compare the full operating cost?
Translate the same implementation into each vendor’s unit, then add data operations and ownership. Counting only active customers can miss repeated flag requests, exposure events, editor seats and warehouse queries.
Use these hypothetical calculations to reveal the differences, not to rank whole products by a partial bill.
| Scenario | Scoped calculation | Decision implication |
|---|---|---|
| Statsig Pro with six million metered events | USD 150 + 1,000 × USD 0.05 = USD 200/month | Count qualifying exposures and other metered inputs first |
| GrowthBook Pro with four paid seats | 4 × USD 40 = USD 160/month | Add the selected warehouse and delivery costs |
| Hosted flags with 20,000 users making 80 billable requests each | 1.6 million requests/month | Users and request volume can cross different allowances |
| Analyst maintaining a metric four hours monthly at an assumed USD 75/hour | USD 300 of internal capacity/month | This is resource cost, not automatically a new cash invoice |
The first two calculations use the linked Statsig and GrowthBook prices. The request count and hourly rate are illustrative assumptions, not measured usage or provider prices. SDK caching and evaluation mode can change billable volume; measure the chosen implementation.
For warehouse-native tools, include query frequency, scan volume, concurrency, permissions and late-data reprocessing. For a hosted tool, include ingestion, sync latency and the cost of maintaining another metric representation. The warehouse-native analytics guide covers that architectural choice in detail.
Also price the failure response. If a limit stops results but leaves a feature serving, someone must notice and decide whether the experiment remains interpretable. If the flag returns a fallback instead, the actual treatment may have changed. Record the cutoff and affected population; do not combine the periods as though the original treatment continued unchanged.
What should the first evaluation actually prove?
It should prove that the chosen plan can deliver the intended experience, reconstruct the analysis population and produce a result the owner can explain. Use a controlled fixture first, then an appropriately planned A/A test and real experiment.
An A/A test assigns the same experience to both groups. It can reveal implementation problems, but one nonsignificant A/A result does not prove the platform is calibrated or the production setup is correct. Check the pipeline directly as well.
| Acceptance case | Evidence to retain | Failure that should block trust |
|---|---|---|
| Refresh, login and account switch | Assignment and identity traces | A unit silently moves to another variant |
| Eligible customer with no conversion | Population extract and metric row | Nonconverters disappear from the denominator |
| Duplicate or late outcome | Canonical event ID and window calculation | Retry inflates conversion or late data changes groups incorrectly |
| Known allocation ratio | Expected and observed assignment/exposure counts | Unexplained sample ratio mismatch |
| Trial ends or allowance is exhausted | Retained-plan entitlement and actual limit behavior | Results disappear or serving behavior changes without an owner |
| Harmful variant | Tested pause/rollback and affected-population record | No way to stop or identify the changed experience |
Investigate sample ratio mismatch before interpreting lift. Microsoft’s research treats it as a symptom with several possible causes, not a number to repair by deleting inconvenient rows. Microsoft SRM research
Use the following path to decide whether to commit to a candidate.
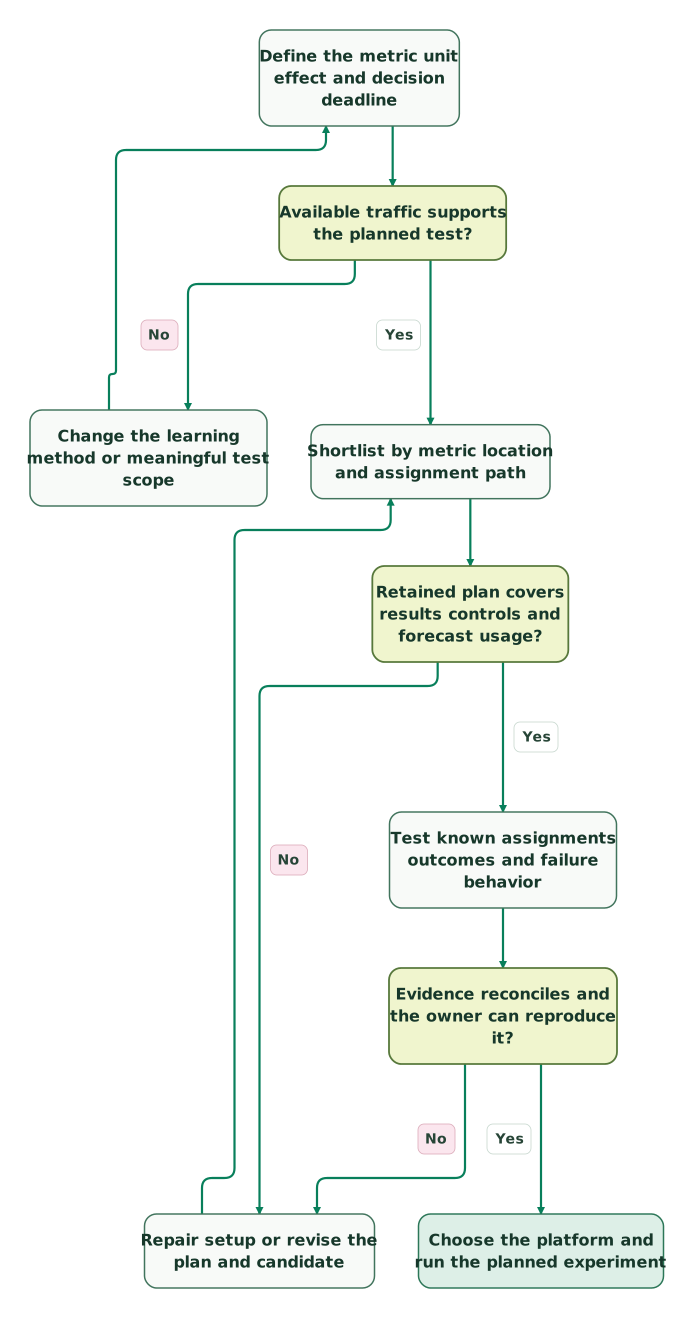
Read diagram as text
- Define the metric unit effect and decision deadline to Available traffic supports the planned test?.
- Available traffic supports the planned test? to Change the learning method or meaningful test scope: No.
- Change the learning method or meaningful test scope to Define the metric unit effect and decision deadline.
- Available traffic supports the planned test? to Shortlist by metric location and assignment path: Yes.
- Shortlist by metric location and assignment path to Retained plan covers results controls and forecast usage?.
- Retained plan covers results controls and forecast usage? to Repair setup or revise the plan and candidate: No.
- Repair setup or revise the plan and candidate to Shortlist by metric location and assignment path.
- Retained plan covers results controls and forecast usage? to Test known assignments outcomes and failure behavior: Yes.
- Test known assignments outcomes and failure behavior to Evidence reconciles and the owner can reproduce it?.
- Evidence reconciles and the owner can reproduce it? to Repair setup or revise the plan and candidate: No.
- Evidence reconciles and the owner can reproduce it? to Choose the platform and run the planned experiment: Yes
The test of a platform is distinct from deciding whether a product variant wins. Selecting the tool authorizes a measured experiment; it does not preapprove whatever the first results suggest.
What belongs on the final buying checklist?
Commit when the retained package, data path and operating owner fit a test worth running.
Checklist
- The primary metric and randomization unit match the business decision.
- Traffic and outcome maturity fit a defensible test design.
- Assignment and exposure are distinct and reconcile under both variants.
- Zero-outcome units, retries and late data behave as intended.
- Results and required controls remain available after the trial.
- The selected statistical engine and stopping rule are recorded.
- Usage forecasts include all relevant meters, environments and shared allowances.
- Warehouse permissions, compute and metric maintenance have owners.
- Quota responses and rollback have been exercised in the chosen setup.
- The intended decision-maker can explain and reproduce the result.
If the shortlist is sound but the first experiment’s inputs are not, request a detailed product analytics implementation scope. If you are still deciding what to measure, start with the $99 martech audit. A smaller test with a dependable denominator is more useful than a sophisticated engine attached to ambiguous events.
Keep reading
Browse all Product Analytics guides
 Product Analytics
Hotjar vs Microsoft Clarity: Compare Replay, Consent and Real Limits
Compare Clarity with Hotjar’s Contentsquare plans on replay limits, consent, masking and migration. Includes a practical test and verified product boundaries.
Jafrin Akter AloLast updated 16 min read
 Product Analytics
Sample Ratio Mismatch: Diagnose an A/B Test Before Reading Lift
Diagnose sample ratio mismatch across assignment, exposures and analysis filters, with a checked Python example, missing-user scenario and recovery criteria.
Jafrin Akter AloLast updated 9 min read
 Product Analytics
GA4 Alternatives: Choose by the Questions You Need to Answer
Compare Plausible, Matomo, Mixpanel, PostHog and a warehouse by the decisions they support. Use a controlled pilot and preserve critical GA4 dependencies.
Jafrin Akter AloLast updated 13 min read
Product analytics
See the implementation scope, deliverables and acceptance checks.
Questions people ask
Do we need a separate platform if analytics already has experiments?
Only when the existing workflow fails a real requirement. Evaluate result access, assignment integration, account-level metrics, governance and the cost at your expected usage. Keeping the analysis near established events can reduce work. A separate tool becomes useful when business metrics live elsewhere or release controls need a different owner, provided the two systems share reliable exposure and identity data.
Does Bayesian testing solve low traffic?
No. Bayesian methods can express uncertainty in a useful form, but limited observations still constrain what the data can establish. Results also depend on the model, prior and decision rule. Define the effect that matters and the cost of a wrong decision before testing. Do not choose a method merely because its dashboard produces an encouraging probability earlier.
Can we keep our existing feature flag system?
Often, if the analysis platform accepts the necessary assignment or exposure records. Verify the exact integration and identity contract in the intended plan. The evaluation must reconcile what was allocated, what was actually experienced and which outcomes belong in the window. Sending a correctly named event is insufficient if it fires before eligibility or only after treatment changes behavior.
Is warehouse-native experimentation automatically cheaper?
No. It can reuse governed business data, but the platform, warehouse compute, metric modeling and operational ownership still cost money or capacity. Compare the same workload and refresh cadence, including late-data processing and concurrency. A hosted system may be simpler when there is no maintained warehouse model; a native design can be valuable when those models already answer the decision.
Should a B2B experiment randomize users or accounts?
Use the unit that can receive an independent, consistent treatment. Shared workspace behavior, team onboarding and account pricing often require account assignment. That reduces the relevant sample to accounts, not seats. Some individual interface changes can use person-level assignment if spillovers are controlled. State the unit before calculating sample size or choosing a platform’s group-analysis capability.
Sources
- Amplitude plans.
- Mixpanel pricing.
- Mixpanel experiments.
- PostHog pricing.
- PostHog Bayesian statistics.
- PostHog frequentist statistics.
- PostHog warehouse experiment metrics.
- PostHog warehouse architecture.
- Statsig pricing.
- Statsig Warehouse Native.
- Amplitude and Statsig partnership.
- GrowthBook pricing.
- LaunchDarkly pricing.
- Datadog Experiments product explanation.
- Optimizely Warehouse-native Analytics.
- R two-sample power reference.
- R power implementation.
- PostHog CUPED scope.
- Microsoft SRM research.
- Amplitude Startup Plan.
- Mixpanel startup program.
- PostHog startup program.
- Statsig startup program.
- Datadog Experiments pricing.
- Datadog for Startups.
- Datadog startup program terms.
- Optimizely Rollouts and Feature Experimentation FAQ.

Written by
Jafrin Akter AloData Engineer and Co-founder at Martechdevs and Growth and Analytics Partners
Jafrin writes practical guides to marketing technology, customer data, analytics and AI workflows. Martechdevs is a Growth and Analytics Partners company.