
Sample Ratio Mismatch: Diagnose an A/B Test Before Reading Lift
Data Engineer and Co-founder, martechdevs
Last updated 9 min read
Sample ratio mismatch means the observed allocation of experiment units differs from the planned allocation more than the statistical check would expect under random assignment. Investigate assignment, exposure logging and analysis filters before interpreting lift. An SRM warning does not identify the cause, and a passing check does not prove the experiment is valid, but ignoring unexplained imbalance can reverse a product decision.
Last updated: 7 September 2026.
Test the experiment's population before its outcome
A product team can calculate a precise conversion rate from the wrong population. Better statistical power will not repair missing treatment users, duplicated control users or a filter that keeps different kinds of people in each group.
The Microsoft Research SRM taxonomy treats mismatch as a symptom of data quality problems rather than a single randomization bug. The practical implication is to examine the path from eligibility to the final analysis population.
Write down the randomization unit first. If a B2B experiment assigns entire workspaces, count unique workspaces for the allocation check. Counting users instead can make a balanced assignment appear imbalanced because workspace sizes differ. Counting events is worse when the treatment is intended to change event frequency.
A sound product analytics implementation preserves the experiment ID, version, randomization unit, assigned variant, assignment time and relevant exposure evidence. Without those records, the analyst may be checking the balance of whatever happened to arrive in a reporting tool rather than the intended experiment population.
Also record the planned allocation. A 90/10 rollout should not be tested against 50/50. If allocation changed, retain the configuration history and examine stable periods with the correct expected probabilities. A single aggregate split can hide a broken interval or flag an intentional ramp as suspicious.
Why dividing by users does not solve the problem
Consider a hypothetical experiment that assigns 5,000 users to control and 5,000 to treatment. Each group genuinely has 250 conversions, so both conversion rates are 5%.
A treatment-side logging bug then loses 500 non-converters from the analysis dataset. Control still has 5,000 users; treatment has 4,500. The observed rates become 5% and approximately 5.56%. The dashboard shows about 11.1% relative lift even though there was no true lift in this constructed example.
Normalizing by the observed denominator did not solve the missingness. It created the misleading rate. Removing 500 random control users to make the counts equal would not recreate the missing treatment population either.
The example deliberately makes the mechanism visible. In a real incident, you usually do not know whether the missing users were converters, non-converters, slow-device users or customers affected most strongly by the change. That uncertainty is why the unexplained SRM should block a confident causal interpretation.
Calculate the diagnostic against the planned split
For fixed assignment probabilities, a common diagnostic is Pearson's chi-squared goodness-of-fit test. Expected counts equal the observed total multiplied by the planned variant probabilities. The statistic sums squared observed-minus-expected differences divided by expected counts.
The SciPy reference documents the test's independent-sampling assumption, expected frequencies and small-count limitations. Use an appropriate exact method or your platform's supported method when the approximation is unsuitable.
Here is an original standard-library Python helper restricted to two variants, fixed probabilities and one diagnostic snapshot. It does not implement sequential monitoring, cluster adjustments or an experiment effect test:
from math import erfc, sqrt


def srm_two_arm(control, treatment, planned_control_share=0.5):
    counts = (control, treatment)
    if any(type(x) is not int or x < 0 for x in counts):
        raise ValueError("Counts must be nonnegative integers")
    if not 0 < planned_control_share < 1:
        raise ValueError("Planned share must be between zero and one")
    total = control + treatment
    expected = (
        total * planned_control_share,
        total * (1 - planned_control_share),
    )
    if min(counts) < 5 or min(expected) < 5:
        raise ValueError("Use a suitable small-sample method")
    statistic = sum(
        (observed - target) ** 2 / target
        for observed, target in zip(counts, expected)
    )
    # Chi-square survival probability with one degree of freedom.
    p_value = erfc(sqrt(statistic / 2))
    return {"chi_square": statistic, "p_value": p_value}


print(srm_two_arm(5200, 4800, 0.5))
The example produces a statistic of 16 and a p-value of approximately 0.0000633. The same proportional imbalance in a much smaller sample can yield a different conclusion because sample size matters. For an intended 80/20 split, counts of 800 and 200 give a statistic of zero when the planned control share is correctly set to 0.8.
A p-value is not the probability that the assignment system is broken. It describes how unusual an imbalance at least this large would be under the stated null model. Nor does it measure the business impact of the bias.
Set your alerting policy before viewing the result. Repeatedly applying a fixed-snapshot threshold to every hour and hundreds of segments can generate false alarms. Research on automated randomization validation and sequential SRM detection explicitly addresses monitoring at scale. Use the platform's documented monitoring approach or have the repeated-check policy reviewed; do not treat the helper above as a complete alerting engine.
Find the first stage where the populations diverge
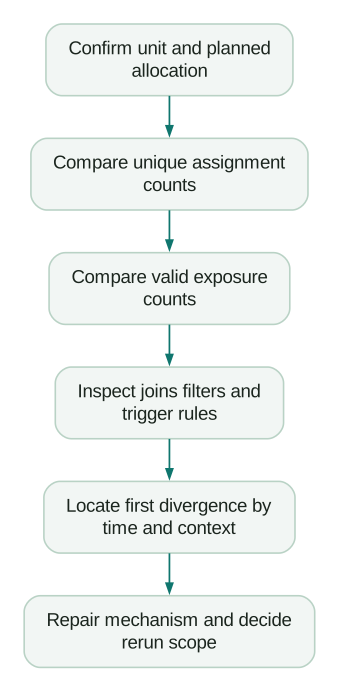
Create a small incident worksheet with counts at each stage and the exact query used to produce them. Preserve the experiment configuration and raw evidence before changing the pipeline.
Start with eligible assignment units. Check whether both variants used the same eligibility rules, stable unit identifier and experiment version. Look for fallback assignments, empty IDs, inconsistent hashing inputs or units that appear in both variants. A cached configuration or an identity reset can produce behavior that a final count conceals.
Then inspect exposures. Were units logged when the relevant experience could affect them, or only after an interaction? Did a treatment redirect occur before the logging request completed? Did one SDK version send an exposure on every render while the other sent one per unit? Deduplicate according to the experiment's unit and exposure policy before comparing counts.
Finally inspect analysis inclusion. Compare the assignment or valid-exposure population with the rows remaining after joins, bot filters, country filters, date restrictions and metric eligibility logic. An inner join to purchases excludes non-purchasers. A join to a user profile table can drop anonymous users differently across variants. Neither failure requires a randomization bug.
Statsig's SRM documentation describes checks and diagnostic dimensions such as SDK version, browser, operating system and region. Those are useful investigation axes, provided their values represent relevant pre-treatment context rather than a state the experiment itself changed.
In the earlier example, assignment counts are 5,000/5,000 but analysis counts are 5,000/4,500. That directs attention downstream of assignment. If exposure counts were already 5,000/4,500, investigate exposure execution or transport before blaming the final SQL.
Be careful with triggered analysis
A triggered analysis focuses on units eligible to encounter a particular experience. It can improve relevance, but the inclusion rule must not select users based on a treatment-induced behavior.
Suppose a treatment adds a recommendation drawer. Filtering both groups to “opened the new drawer” cannot create comparable populations because control users cannot perform that action. Even a more subtle condition such as “clicked a recommendation” may be affected by the treatment.
A more defensible starting point is a common opportunity condition that exists before the changed experience, such as reaching an eligible product page with a supported layout. The exact condition still needs review for the experiment design, timing and equivalent logging in both variants.
Microsoft's diagnostic guidance highlights the value of comparing untriggered and triggered populations. If the full assigned population is balanced and the triggered analysis is not, inspect the trigger and its logging before interpreting the segment's lift.
Do not confuse diagnostic segmentation with selecting a convenient winning audience. Finding that an issue starts with one browser release is evidence for an engineering investigation. It does not automatically authorize deleting that browser from the result and declaring the remaining effect causal.
Inspect time and segments without hiding the incident
Plot counts and the configured allocation by stable time interval. A sharp divergence after a deployment suggests a different investigation from a mismatch present since the first exposure. Allow for legitimate ingestion delays before comparing incomplete intervals.
Then inspect a small set of technically plausible segments: application version, SDK version, browser family, region, logged-in state at assignment and collection endpoint. Use counts as well as p-values. A tiny segment with a dramatic ratio may have a different operational priority from a large segment with modest imbalance.
Check for cancellation at the aggregate level. One browser can overrepresent treatment while another underrepresents it, yielding a superficially balanced total. Conversely, a segment defined using a post-treatment action can create imbalance even when assignment was valid. Treat segment findings as hypotheses and connect them to a mechanism in the logs or code.
For workspace-randomized tests, keep workspace-level counts in the allocation diagnostic even while inspecting user-level telemetry as supporting evidence. A treatment that legitimately increases the number of active users per workspace should not be “fixed” by forcing user counts to balance.
An event naming convention and a clear tracking plan help here because the same event name should not represent exposure in one application and successful interaction in another.
Decide whether the result can be recovered
A known query defect may be repairable when complete source records still exist and the corrected analysis implements the originally intended population. Rebuild the result, rerun quality checks and document what changed.
Missing source exposures are harder. If the missingness depends on treatment behavior and cannot be reconstructed, adjusting the denominator or weighting the surviving users is not a routine repair. A fresh experiment after the fix may be the most defensible route.
A configuration ramp can sometimes explain the apparent mismatch without a defect, but validate the expected allocation for the relevant periods and units. Do not simply choose an expected ratio that matches the observed data after the fact. The allocation must come from the assignment design, not from the answer you want.
Record the decision with an owner: recovered from complete evidence, restricted to a justified predeclared population, or invalidated and rerun. If the product needs an urgent operational decision while evidence is unreliable, label that decision as a risk or product judgment rather than presenting the broken experiment as causal proof.
Put prevention into the release process
- The randomization unit and fixed or changing allocation are recorded before launch.
- Assignment identifiers remain stable across refresh, login and supported clients.
- Each variant logs the common exposure opportunity under equivalent conditions.
- Crossover units and duplicate exposure records are measured explicitly.
- Analysis joins preserve non-converters and the intended unit population.
- Triggered filters are checked for treatment-dependent selection.
- Monitoring thresholds and repeated-check behavior are documented.
- The incident decision includes the cause, affected interval and recovery evidence.
Run an A/A or limited validation exercise when changing the assignment or exposure pipeline. It can reveal implementation defects, but a clean A/A does not guarantee that a future treatment cannot break logging. Continue checking the actual experiment after its code path is active.
Once population integrity is established, evaluate effect size, uncertainty, guardrails and commercial relevance. SaaS activation metrics can help choose an outcome worth testing; SRM diagnosis makes it more likely that the measured outcome belongs to a trustworthy comparison.
Questions people ask
Does every unequal split mean sample ratio mismatch?
No. Random assignment produces ordinary variation, and the expected split may not be 50/50. Evaluate unique randomization-unit counts against the configured allocation using an appropriate statistical method.
Can I trust conversion lift if I divide by users in each group?
Not when unexplained missingness changes who remains in each group. Rates can still be biased, as the worked example shows, so investigate the population before interpreting the lift.
Does passing the SRM check prove an experiment is valid?
No. Balanced counts can coexist with wrong metrics, crossovers, symmetric logging loss or offsetting segment problems. SRM is one quality diagnostic within a broader experiment review.
Should I delete users to make the groups equal?
No. Equalizing row counts does not recover missing users or repair biased inclusion. Identify the mechanism and rebuild from valid source evidence, or rerun when recovery is not defensible.
What should a B2B experiment use as its sample unit?
Use the unit the experiment actually randomized, often a workspace or account for shared product experiences. User activity can inform the diagnosis, but it should not replace the assignment unit in the allocation test.
Sources
- Microsoft Research: SRM taxonomy and rules of thumb. Accessed 7 September 2026.
- SciPy: Pearson's chi-squared test. Accessed 7 September 2026.
- Research paper: Automated randomization validation and SRM detection. Accessed 7 September 2026.
- Statsig: SRM checks. Accessed 7 September 2026.
- Microsoft Research: Diagnosing SRM in A/B testing. Accessed 7 September 2026.
Written by
Jafrin Akter AloData Engineer and Co-founder, martechdevs
Jafrin Akter Alo is a data engineer and co-founder of martechdevs, where the team has delivered 74+ martech, data and growth stack implementations.