
Marketing Analytics Tools: Collection, Channel Data and Reporting
The best marketing analytics tools depend on the decision your team needs to make. GA4 and Plausible measure website activity, Data Studio presents reports, and Supermetrics connects marketing data across platforms. A useful stack assigns each job clearly. Start with the source data and metric definitions, then buy the reporting or connection capability that removes a specific operating problem.
On this page
Marketing analytics tool shortlist
USD prices below show the stated product scope and billing basis; connector, usage and project requirements can change the total.
| Tool | Primary role | Entry or relevant paid example | Main selection condition |
|---|---|---|---|
| Google Analytics 4 | Website and app measurement | Standard Analytics available free of charge | Google marketing measurement and a maintained event setup |
| Plausible | Focused website and campaign reporting | Starter $9/month; Business $19/month at the displayed 10,000 monthly pageview tier | Simple website questions; Business for revenue tracking |
| Data Studio | Shared dashboards and reporting | No-charge self-service; Pro project subscription $9/user/project/month | Data sources already available with suitable access |
| Supermetrics | Marketing data connections and preparation | Starter from $59/month monthly or $44/month billed yearly | Repeated work combining supported marketing sources |
See Google Analytics, Plausible plans, Data Studio pricing and Supermetrics packages. These products have different responsibilities. A connector subscription does not define your accepted lead, and a dashboard does not repair an event emitted before a purchase succeeds.
We would begin with one business outcome, one channel comparison and one accountable owner. For a small marketing site, that can mean a focused collection tool and a clear weekly report. For a team combining paid media, CRM and revenue, it usually means a separate data preparation step before presentation.
Our analytics and tracking service connects those responsibilities through event definitions, reporting logic and acceptance checks. The target is a report the team can use to make a decision, with an explanation for where each number came from.
Tool decision blocks
Google Analytics 4
- Best for: Teams measuring website or app acquisition and outcomes within a wider Google marketing workflow.
- Pros: Analytics supports customer-journey analysis and connections to Google's marketing products. Recommended events provide established names and parameter conventions for useful outcomes. Analytics overview, recommended events.
- Cons: Collection, identity, key-event definitions and report scope still need maintenance. A free license does not eliminate implementation work or make all platform attribution totals comparable.
- Free plan and startup offer: Standard Analytics is offered free of charge. The regular budget here assumes that standard product, with no startup credit or paid enterprise entitlement. Google Analytics offer.
- Choose it if: A named owner can maintain the important events and explain how the reports relate to campaign and business outcomes.
- Skip it if: Your only requirement is a simple website traffic and goal report, and the team does not need the broader measurement workflow.
Plausible
- Best for: Website owners who want a focused view of traffic, campaign sources, pages and defined conversion goals.
- Pros: A compact website reporting model reduces the number of reporting choices. Business adds revenue tracking, a Data Studio connector and additional analysis features. Plausible plans, revenue tracking.
- Cons: Plausible's visitor model does not use persistent identifiers across days or devices. That limits its fit for long-lived identified customer journeys. Custom events also contribute to the billed traffic tier. Metric definitions, subscription usage.
- Free plan and startup offer: Hosted Plausible provides a 30-day trial without a credit card. The budget uses the displayed paid traffic tier; it assumes no ongoing hosted free allowance or startup promotion. Hosted plans.
- Choose it if: Website traffic, landing-page performance and a defined set of goals cover the decisions you need to make.
- Skip it if: The central requirement is following authenticated users across a longer product and account lifecycle.
Data Studio
- Best for: Teams with usable source data that need shared, interactive marketing dashboards.
- Pros: Google connectors include Analytics, Google Ads, Search Console, Sheets and BigQuery. Pro adds administrative and team-content capabilities. Available connectors, Pro features.
- Cons: Sharing and data access require deliberate credential choices. A report can present an incorrect join very clearly, so the data model needs its own acceptance tests.
- Free plan and startup offer: Self-service reporting is available at no charge. Pro has a 30-day organizational trial, after which billing starts automatically unless cancelled. No separate startup credit is included here. Data Studio pricing, Pro trial.
- Choose it if: The team has an agreed dataset and needs accessible reports with a defined owner and refresh process.
- Skip it if: The unresolved problem is collecting missing events or assembling data that has no supported connection or maintained pipeline.
Supermetrics
- Best for: Marketing teams repeatedly moving supported platform data into reporting destinations.
- Pros: Its packages cover marketing-source connections and destinations such as Data Studio and Sheets. Starter lists one core destination, one user and two accounts per data source. Supermetrics packages.
- Cons: Source, account, user and destination requirements affect the package. Confirm the exact source fields and destination features needed before treating an entry price as the complete stack budget.
- Free plan and startup offer: A 14-day trial is available without payment details. The budget assumes a regular paid package afterward, with no startup promotion. Trial and package terms.
- Choose it if: Repeated source extraction is the operating bottleneck and the selected connectors support the required fields and accounts.
- Skip it if: Native connections already supply the required dataset and the remaining work is metric definition or report design.
Best fit by operating model
| Operating model | Best fit | Runner-up | Reason |
|---|---|---|---|
| Small content or lead website | Plausible | GA4 | Focused traffic and goal reporting, with GA4 available for broader measurement needs |
| Website and app team using Google marketing products | GA4 | Plausible for the website portion | Broader measurement scope; the runner-up covers a narrower website job |
| Small team reporting on existing Google data | Data Studio with native connectors | GA4's own reports | Shared presentation when an in-product report is insufficient |
| Agency repeatedly combining supported paid sources | Supermetrics feeding the reporting destination | Data Studio with maintained manual imports | Automated source work versus a smaller, explicitly manual reporting process |
| Team with a prepared warehouse dataset | Data Studio | Supermetrics for additional source ingestion | Presentation is the immediate job; new source collection is a separate purchase |
The runner-up should match the actual constraint. A team can use GA4, Supermetrics and Data Studio together because collection, data connections and presentation are different jobs. A comparison becomes misleading when it treats all three subscriptions as interchangeable ways to solve the same problem.
For a dedicated website measurement choice, see Google Analytics vs Plausible. For reporting licenses and project ownership, the Data Studio pricing guide covers the cost structure more deeply.
Measurement definitions before dashboard design
Choose the outcome that matters to the decision. A campaign click, website session, accepted lead and paid order belong to different stages. A lead-generation dashboard should make those stages visible rather than substituting a form button click for an accepted lead.
Use a business record to validate the outcome where one exists. Record the population, time window and currency basis. If the marketing report covers only website orders, exclude other sales channels from the comparison or show them separately. Do not describe a known collection boundary as unexplained missing revenue.
GA4 recommended events provide a useful starting vocabulary, but they still require the associated context. Plausible revenue tracking attaches monetary values to custom events and is a Business feature. In either case, the event must occur at the appropriate business boundary. GA4 event conventions, Plausible revenue events.
Keep a tracking plan that names the producer, required parameters and acceptance condition. A new tool should inherit that definition rather than introducing a second meaning for the same outcome.
Visitor and user counts also need a stated definition. Plausible counts the same person on different days or devices as separate visitors under its non-persistent model. That makes its totals unsuitable as a direct substitute for a persistent customer identity. Plausible metrics.
Campaign joins and duplicated spend
A cross-channel report needs compatible row detail before it needs a chart. Advertising data might have one row per account, campaign and day. Order data might have several rows per campaign and day. Joining the spend row directly to every order repeats spend.
Consider a hypothetical single-day USD dataset. Campaign A spends USD 100 and produces three attributed orders worth USD 50, USD 70 and USD 80. Campaign B spends USD 300 and produces one attributed order worth USD 300. Assume these attribution labels are already assigned under the team's chosen rule.
| Campaign | Spend | Order revenue | Correct revenue/spend |
|---|---|---|---|
| A | USD 100 | USD 200 | 2.00 |
| B | USD 300 | USD 300 | 1.00 |
| Total | USD 400 | USD 500 | 1.25 |
A direct join to the four order rows repeats Campaign A's USD 100 spend three times. Campaign B's spend appears once. The resulting sum is USD 600, and the misleading return is 500 ÷ 600 = 0.83 rather than 500 ÷ 400 = 1.25.
Aggregate orders to the agreed campaign/day key before joining them to campaign/day spend. Include the source account in the key when campaign IDs can overlap across accounts. Align time zones and currencies before combining values, and preserve unmatched campaigns for investigation instead of silently dropping them.
Test both the total and the campaign rows. A total can look reasonable while individual campaign assignments are wrong. Check uniqueness on the intended join key and reconcile the inputs before and after the join. These tests belong in the data preparation step regardless of the reporting tool.
The same care applies to averages. Suppose Campaign A has 1,000 clicks and Campaign B has 300. Their costs per click are USD 0.10 and USD 1.00. The combined cost per click is 400 ÷ 1,300 = approximately USD 0.31, not the simple average of USD 0.55. Sum the numerator and denominator first.
The ROAS calculator can check the arithmetic once the spend and attributed revenue inputs are defined. The ratio itself does not establish incremental revenue caused by advertising; causal impact requires a different analysis and appropriate comparison design.
Access, refresh and ownership
A dashboard needs an owner for its data access as well as its layout. In Data Studio, Owner's Credentials let viewers access the source using the credential owner's authorization. Viewer's Credentials require each viewer's own underlying access. Review that choice before sharing a report containing restricted business data. Data credentials.
Test the report using the intended viewer's access conditions. A report that works only for its author is not a finished handoff. Conversely, a broadly shared report can expose data through owner credentials even when a viewer lacks direct source access. Match the report audience to the intended permission model.
Set a freshness requirement by decision. A weekly channel allocation review and an intraday campaign intervention need different refresh behavior. Display the covered period and last successful refresh, and define what happens after a source failure. An old result should remain visibly old rather than appearing to be a successful current refresh.
For a paid connector evaluation, test the actual accounts, fields and destination. Include historical retrieval, a normal refresh and a failed authorization scenario. Record which person or organizational identity maintains each connection and how the team will replace that dependency when ownership changes.
Stack budget and usage boundaries
Price the selected roles together. The following examples are hypothetical recurring subscription budgets in USD, excluding tax, implementation and unrelated products. They use the displayed offers above, with no startup discount.
| Example | Calculation | Recurring amount | Boundary |
|---|---|---|---|
| Focused website revenue reporting | Plausible Business at displayed traffic tier | USD 19/month | Workload remains within the selected tier |
| Three Pro reporting users in one project | 3 × USD 9 | USD 27/month | Project subscription scope |
| Entry connector plus those Pro users | USD 44 + USD 27 | USD 71/month equivalent | Connector billed yearly; package fit confirmed |
| Twelve months of that same scope | USD 528 + USD 324 | USD 852/year | No usage or license expansion |
| Monthly connector billing plus Pro users | USD 59 + USD 27 | USD 86/month | Same assumed package scope |
The USD 44 connector figure represents a USD 528 yearly commitment at the displayed entry rate. The Pro example is a separate user/project charge. Confirm the selected subscription terms and source requirements before purchasing. Supermetrics pricing, Data Studio pricing.
Plausible's subscription usage includes pageviews and custom events across the team's sites. A hypothetical 7,500 pageviews plus 1,500 custom events equals 9,000 billable units. Adding another 2,000 tracked custom events brings that workload to 11,000, above the displayed 10,000-unit entry example. Select the appropriate tier rather than pricing only visible page loads. Plausible usage calculation.
Budget for the ongoing reporting owner separately using an agreed monthly amount. The relevant operating tasks include checking failed refreshes, maintaining event definitions and reviewing changed source fields. A license quote should not imply those responsibilities disappear.
Evaluation and release workflow
Use the trial to answer one real reporting question with a bounded dataset. Select a known period, reconcile the source totals and test the intended viewers. The goal is a repeatable result with known limits, not the largest number of connected sources.
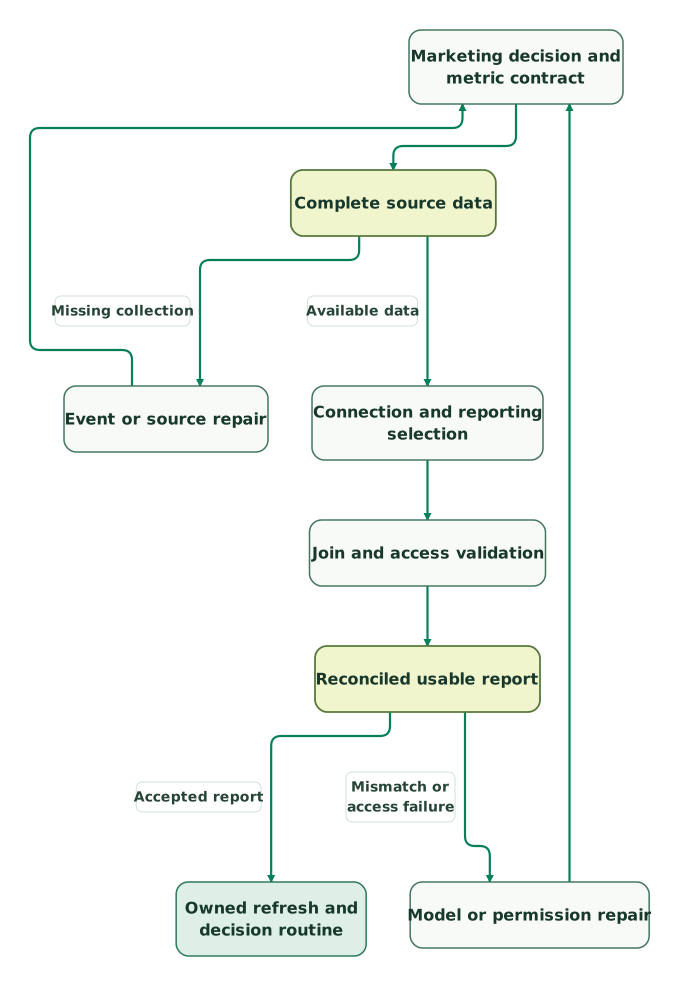
Read diagram as text
- Marketing decision and metric contract to Complete source data.
- Complete source data to Event or source repair: Missing collection.
- Event or source repair to Marketing decision and metric contract.
- Complete source data to Connection and reporting selection: Available data.
- Connection and reporting selection to Join and access validation.
- Join and access validation to Reconciled usable report.
- Reconciled usable report to Model or permission repair: Mismatch or access failure.
- Model or permission repair to Marketing decision and metric contract.
- Reconciled usable report to Owned refresh and decision routine: Accepted report
A change to the event definition, source population or join key can invalidate earlier tests. Return to the metric contract after those repairs. Keep a small accepted dataset so the team can repeat the check when a connector, campaign structure or dashboard changes.
Marketing analytics selection checklist
- Business decision and accepted outcome named.
- Collection, connection and reporting roles assigned.
- Required source accounts, fields and history confirmed.
- Row detail, join keys, currencies and time boundaries aligned.
- Spend, revenue and denominator totals reconciled.
- Intended viewers tested under the chosen credentials.
- Refresh expectations and failure ownership documented.
- Regular subscription and usage scope priced together.
The tracking plan audit skill helps review the measurement contract before a tool purchase. A GA4 audit is the next step when the main uncertainty is whether the existing collection matches the business outcome.
Keep reading
Browse all Data Warehouse guides
 Product Analytics
Google Analytics vs Plausible for website reporting
Choose Plausible or Google Analytics by website reporting needs, visitor identity and advertising dependencies, with usage costs and migration checks.
Jafrin Akter AloLast updated 11 min read
 Data Warehouse
Data Studio Pricing 2026, Formerly Looker Studio: Free, Pro at $9 and the Real Reporting Budget
Data Studio, formerly Looker Studio, is free. Pro lists $9 per user per project monthly. Compare licences, connector plans and BigQuery reporting costs.
Jafrin Akter AloLast updated 21 min read
 Tracking & Attribution
Tracking Plan: Free Template, Examples by Business Type and How to Build One
A tracking plan defines each event: when it fires, its properties, IDs, owner and tools. Get a free two-tab template, six examples and an approval checklist.
Jafrin Akter AloLast updated 42 min read
Analytics & tracking
See the implementation scope, deliverables and acceptance checks.
Questions people ask
Can GA4, Supermetrics and Data Studio belong in the same stack?
Yes. They can handle different responsibilities: collecting measurement data, connecting marketing sources and presenting reports. Assign the role and owner for each product so the stack does not create competing definitions. Start with the smallest combination that answers the decision, then add a connection or reporting capability only when the existing workflow has a specific gap.
Is Plausible Starter enough for a website revenue report?
Plausible's revenue tracking is a Business feature, so the Starter price should not be used for that requirement. Confirm the required features and billable traffic tier together. Custom events count toward usage alongside pageviews. For a simple traffic and goal report, a smaller plan may fit, but a revenue workflow needs the appropriate plan and event setup.
Why can a campaign dashboard show more spend than the ad platform?
One possible cause is a join that repeats each campaign spend row across several orders or events. Check the row detail and join key before changing the source extraction. Aggregate both sides to the intended campaign and period, then reconcile totals and unmatched keys. Other differences can come from currencies, time boundaries or the selected account population.
Does a paid connector make attribution across channels consistent?
No. A connector moves fields from source systems, while attribution definitions can still differ by platform, window and business rule. Preserve those definitions and choose the comparison the report is meant to support. Validate the underlying outcomes separately from channel credit. A combined dashboard is useful only when readers understand what its attributed revenue or conversion count represents.
Should a small marketing team begin with a warehouse?
Only when the reporting job requires the history, joins or control that justify maintaining one. A focused website report or a small set of native connections may be sufficient initially. Start with a defined outcome and reconciliation test. Add a warehouse when the source complexity and recurring analysis need it, with an owner for the models and refresh process.
Sources
- Google: Analytics overview and standard offer
- Google: Recommended events
- Plausible: Product and displayed plans
- Plausible: Subscription plans and usage
- Plausible: Metric definitions
- Plausible: Ecommerce revenue tracking
- Google: Data Studio product and pricing
- Google: Data Studio Pro features and trial
- Google: Available Data Studio connectors
- Google: Data credentials
- Supermetrics: Packages and trial

Written by
Jafrin Akter AloData Engineer and Co-founder at Martechdevs and Growth and Analytics Partners
Jafrin writes practical guides to marketing technology, customer data, analytics and AI workflows. Martechdevs is a Growth and Analytics Partners company.