
LTV to CAC Ratio: Formula, Benchmarks and the Forecast Behind the Number
The lifetime value to customer acquisition cost ratio compares the value a customer is expected to generate with the cost of acquiring that customer. For an acquisition decision, state whether value means revenue, gross profit or contribution, then use a consistent customer cohort and cost scope. A 5:1 forecast can look attractive while most of its value lies years beyond the history you have observed.
On this page

What should LTV mean in your acquisition model?
LTV should name the economic value the decision requires, including the costs deducted and the period covered. Revenue LTV, gross-profit LTV and contribution LTV are different measures. Calling all three “customer value” makes a benchmark comparison unreliable before anyone checks the arithmetic.
| Value basis | What is counted | What still needs to be covered |
|---|---|---|
| Revenue LTV | Customer revenue over the stated or forecast relationship | Serving costs, acquisition costs and other operating costs |
| Gross-profit LTV | Revenue less the agreed cost of delivering the service | Acquisition expense and costs outside that gross-margin definition |
| Contribution LTV | Revenue less the specifically defined customer-related variable costs | Acquisition cost, if not already deducted, and remaining fixed costs |
Define lifetime value before acquisition expense when using it as the numerator of an LTV:CAC ratio. If another model already subtracts CAC, retain that definition separately rather than charging acquisition twice or comparing the resulting net value with a pre-acquisition benchmark.
Andreessen Horowitz's metric guidance emphasizes future profit or contribution and warns that revenue and gross margin can imply a higher spending limit. Decide the required basis with finance, then keep its cost components visible.
Tool labels also need inspection. ChartMogul's general metric guide presents a gross-margin-adjusted formula, while its actual LTV report uses ARPA divided by trailing six-month customer churn, excluding the current month from that churn average. The report is a revenue estimate. Generic formula, ChartMogul report calculation
How do you calculate LTV to CAC with consistent inputs?
Divide the chosen customer-value measure by acquisition cost for the same customer population. For a simplified subscription business with constant monthly revenue, gross margin and customer churn, the gross-profit version is:
Monthly gross profit per customer = monthly ARPA × gross margin
Simple lifetime gross profit = monthly gross profit / monthly customer churn
LTV:CAC = lifetime gross profit / CAC per acquired customer
ARPA means average revenue per account. Use customer or account churn consistently with that entity; net revenue churn is a different measure that includes expansion and can become negative. A zero observed churn rate does not establish an infinite customer lifetime. The formula needs assumptions that the observed history may not yet support. Simple LTV formula and limitations
Reuse the hypothetical USD inputs from our CAC payback guide: USD 30,000 allocated acquisition cost, 20 new paying customers, USD 250 monthly ARPA and 75% gross margin. Add an assumed constant 2.5% monthly customer churn, with no expansion or discounting.
| Calculation | Inputs | Result |
|---|---|---|
| Fully loaded CAC | USD 30,000 / 20 customers | USD 1,500 |
| Monthly gross profit | USD 250 × 0.75 | USD 187.50 |
| Simple gross-profit LTV | USD 187.50 / 0.025 | USD 7,500 |
| Gross-profit LTV:CAC | USD 7,500 / USD 1,500 | 5.0:1 |
| Revenue-only LTV:CAC | (USD 250 / 0.025) / USD 1,500 | About 6.67:1 |
| Gross-profit LTV versus media-only CAC | USD 7,500 / USD 600 | 12.5:1 |
The USD 600 media-only CAC comes from the same example's USD 12,000 media expense divided by 20 customers. It excludes the allocated people, tools and external work in the fully loaded figure. Those definitions explain why one business can produce three different ratios without any change in customer behavior.
Keep unsuccessful acquisition effort in the cost pool and document sales-cycle allocation. Do not give every organic customer to a paid channel simply because that lowers its cost per acquisition. A warehouse model joining customer revenue and acquisition expense makes those calculations repeatable once the allocation policy is agreed.
Is 3:1 a good LTV to CAC ratio?
Three to one is a commonly used decision reference, but its meaning depends on the value basis, customer segment, forecast reliability and time to recovery. A ratio above three does not establish that the next acquisition campaign will return the same value.
| Reference | Published guidance | Basis to preserve |
|---|---|---|
| David Skok's SaaS definitions | LTV:CAC above 3 | His stated guideline assumes the simpler revenue formula and gross margin of at least 80% |
| Bessemer's cloud-company guidance | Invest in acquisition at 3x or above; continue testing below it | Gross-margin-adjusted customer value |
| Stripe's payback guide | Describes 3:1 or above as a generally accepted reference | Its LTV discussion describes lifetime revenue |
Sources: Skok's explicit assumptions, Bessemer's CLTV guidance, Stripe's comparison.
For illustration, a revenue-based 3.0:1 at a 75% gross margin becomes 2.25:1 on a gross-profit basis, with CAC unchanged. That conversion does not make Skok's high-margin assumption apply to a lower-margin business. It demonstrates why the numerator belongs beside the benchmark.
Below 1.0 on a gross-profit basis, the modeled gross profit does not recover acquisition expense. At exactly 1.0, those two amounts match, but other operating costs remain. Above 1.0, ask how much residual value remains after the relevant costs and how long you must finance the wait.
A very high ratio is a reason to investigate, not an instruction to spend more immediately. It can reflect strong economics, omitted costs, optimistic retention or a small efficient audience that will not expand at the same price. Test the incremental customer group at the proposed spending level.
How much of the lifetime ratio is still beyond the first year?
Calculate value over a fixed horizon to see how heavily the lifetime result depends on distant assumptions. Under the example's constant 2.5% monthly churn, each successive month's expected gross profit is multiplied by 0.975.
The model assumes the customer generates the first month's USD 187.50 before any month-end churn. There is no expansion, change in serving cost or discounting. Constant churn probability produces exponential survival; it does not mean losing the same number of customers every month.
Expected first-12-month gross profit per acquired customer
  = 187.50 × (1 + 0.975 + 0.975² + ... + 0.975¹¹)
  = about USD 1,965.01

First-12-month expected value / CAC = 1,965.01 / 1,500 ≈ 1.31
Share of USD 7,500 lifetime estimate after month 12 ≈ 73.8%
Nearly three quarters of this particular 5.0:1 lifetime estimate sits after month twelve. That is model output, not revenue already earned. A young cohort has not validated those later months merely by passing onboarding.
The following sensitivity holds monthly gross profit and CAC constant. Every row is a hypothetical churn scenario, with amounts in USD.
| Monthly customer churn | Infinite-horizon gross-profit LTV | Lifetime LTV:CAC | Expected first-12-month gross profit |
|---|---|---|---|
| 1.0% | 18,750 | 12.5:1 | 2,130.28 |
| 2.5% | 7,500 | 5.0:1 | 1,965.01 |
| 5.0% | 3,750 | 2.5:1 | 1,723.65 |
The lifetime number moves much more than the first-year value because the formula extends the survival assumption indefinitely. Show that sensitivity before arguing over whether the reported ratio is 4.8 or 5.0.
Keep churn periods consistent. Under a constant 2.5% monthly probability, annual churn is 1 - 0.975^12, about 26.2%. Multiplying by twelve gives 30%, which ignores the shrinking population exposed to later churn. Neither conversion proves that your actual annual-contract customers follow a constant monthly pattern.
What does research show about simple LTV forecast errors?
Simple LTV forecasts can miss substantially even when their median error is small. ChartMogul compared signup-time revenue predictions with summed MRR for 35,512 company-quarter cohorts from 3,331 accounts, excluding incomplete windows. These cohorts began between Q1 2020 and Q4 2024. The study measured revenue rather than gross profit or cash. ChartMogul's SaaS LTV report
| Reported finding | Result | Interpretation |
|---|---|---|
| Twelve-month absolute prediction error above 50% | 28.3% of cohorts | A small median concealed large individual misses |
| Median error at 12, 24 and 36 months | −2.4%, +6.9%, +14.4% | Negative meant overprediction; positive meant underprediction |
| ARPA mismatch contribution to variation in prediction accuracy | 84.9% | The study's error decomposition, not proof of a universal causal effect |
| Twelve-month survival by signup-price quartile | 74% lowest; 45% highest | The sample skewed toward SMB and included substantial B2C; this is not an enterprise retention law |
Check whether new customers resemble the installed base behind the forecast. Historical expansion can inflate blended ARPA; future expansion can also make a flat-revenue projection too low.
Freeze the prediction made at acquisition and compare it with the same cohort at the promised horizon. Do not replace the original forecast with today's assumptions and then describe the improved fit as historical accuracy. Keep the error definition and denominator visible when reviewing the model.
How do you calculate observed value from an acquisition cohort?
Divide the cohort's cumulative gross profit by its original acquired-customer count, then compare that value with CAC using the same population. Keep churned customers in the denominator. Removing them rewards the model for ignoring the customers whose economics were weakest.
The payback guide's separate hypothetical cohort ledger assigns USD 30,000 to 20 customers. Its first eight monthly gross-profit amounts are USD 3,000, 3,300, 3,600, 3,900, 4,200, 4,500, 4,800 and 5,100. They total USD 32,400: USD 1,620 per acquired customer and 1.08 times acquisition cost by month eight.
If that ledger then continued with USD 5,400, 5,700, 6,000 and 6,300, the twelve-month total would be USD 55,800, or USD 2,790 per original customer and 1.86 times CAC. Until those four months occur, that extension is a scenario. It must not appear in the observed column.
| View of this hypothetical ledger | Gross profit included | Value per original customer | Value/CAC |
|---|---|---|---|
| First eight completed monthly buckets | USD 32,400 | USD 1,620 | 1.08 |
| Twelve-month scenario with the four stated future buckets | USD 55,800 | USD 2,790 | 1.86 |
| Actual twelve-month value while only eight months are complete | Not yet observed | Not yet observed | Not yet observed |
This Python helper calculates value only from the completed buckets supplied. Inputs are integer cents in one currency, and negative adjustments remain valid. The list must contain consecutive completed months from acquisition; an omitted month cannot be detected from the amounts alone.
from fractions import Fraction


def cohort_value_to_date(acquisition_cost_cents, acquired_customers,
                         monthly_gross_profit_cents):
    if type(acquisition_cost_cents) is not int or acquisition_cost_cents <= 0:
        raise ValueError("Acquisition cost must be positive integer cents")
    if type(acquired_customers) is not int or acquired_customers <= 0:
        raise ValueError("Acquired customers must be a positive integer")
    if not isinstance(monthly_gross_profit_cents, (list, tuple)):
        raise ValueError("Supply a list or tuple of completed monthly amounts")
    if not monthly_gross_profit_cents:
        raise ValueError("At least one completed month is required")
    if any(type(value) is not int for value in monthly_gross_profit_cents):
        raise ValueError("Monthly gross profit must use integer cents")
    total = sum(monthly_gross_profit_cents)
    return {
        "completed_months": len(monthly_gross_profit_cents),
        "gross_profit_cents": total,
        "value_per_acquired_customer_cents": Fraction(total, acquired_customers),
        "value_to_cac": Fraction(total, acquisition_cost_cents),
    }


observed = [300000, 330000, 360000, 390000,
            420000, 450000, 480000, 510000]
result = cohort_value_to_date(3000000, 20, observed)
print(result["completed_months"], float(result["value_to_cac"]))
The example prints 8 1.08. Fractions preserve the exact ratio internally; display rounding belongs at the end. The helper does not estimate future retention, infer missing customers or calculate a lifetime from eight months of history.
Build retention cohorts using the same acquisition identities and reporting ages. A twelve-month cohort can be compared with another cohort's first twelve months. A four-month cohort needs its own shorter observed window, even if a dashboard can draw twelve columns for it.
How should you add a forecast after the observed history?
Add an explicitly bounded forecast using the cohort's own revenue, retention, expansion and serving-cost assumptions. Preserve the observed component and show the future component separately.
Use a clean MRR movement model to distinguish new business, expansion, contraction and churn. Expansion belongs to the original acquired customers; another cohort's growth cannot improve their lifetime value. If expansion requires meaningful sales or success work, include that cost under the model's agreed contribution policy.
Keep net revenue retention beside the value forecast to explain how expansion, contraction and churn change existing-customer revenue. Preserve the original cohort membership so adding new customers cannot improve its retention result.
For a forecast built at acquisition with end-of-month value, an explicit discounted model is:
Present value over H months
  = sum(expected cohort contribution in month t / (1 + d)^t)
    for t = 1 through H

Equivalent monthly discount rate d
  = (1 + annual discount rate)^(1/12) - 1
Finance should choose the discount assumption and explain its use. Do not put an annual discount rate into a monthly formula without converting the period. If the valuation date is after acquisition, distinguish historical value already generated from the remaining future value; do not discount the same history twice or silently move the valuation date.
a16z recommends historical value at twelve and twenty-four months when a young business lacks credible lifetime evidence. A finite observed view plus a downside, base and upside forecast is more informative than an infinite result calculated from one early churn rate.
For each forecast, retain the origin date, definition version, eligible cohort, horizon and assumed inputs in the underlying model. Those are operating records for reproducing the number. Keep subsequent forecasts alongside the original so model revisions remain distinguishable from customer performance.
How should LTV:CAC and payback influence an acquisition test?
Use LTV:CAC to assess the size and uncertainty of the modeled return, and payback to assess recovery speed. Cash planning needs a separate view of actual spending and collections. The ratio alone has no time unit.
The USD 1,500 CAC and USD 187.50 monthly gross-profit example has an eight-month flat-profit payback shortcut. Once its 2.5% churn assumption is included in the expected survival series, cumulative expected gross profit first exceeds CAC in month nine. The 5.0:1 lifetime ratio and the eight-month shortcut therefore use different retention assumptions unless the distinction is stated.
Segment before expanding spend. Keep the customer's acquisition channel, entry plan and size fixed for cohort analysis; changing the channel label after a later sales touch can move both the credit and the apparent economics. a16z's paid-versus-blended CAC discussion explains why an efficient blended average cannot establish the economics of a paid campaign.
For a proposed expansion, agree the budget, customer segment, observation window and stop conditions. Evaluate the next group of customers against that plan, including unsuccessful acquisition effort. Use marketing attribution as evidence about acquisition paths while preserving the separate cost ledger.
Test the mechanism behind an improvement. A discount can lower acquisition cost while reducing value. A support cut can improve short-term margin while weakening retention. A smaller campaign can improve average efficiency simply by abandoning the expensive audience. Review the corresponding cohort outcomes before interpreting the ratio as a durable operating improvement.
When retention is the proposed lever, connect a specific intervention to the risk signal and compare outcomes against a suitable untreated group. The AI churn-prevention guide explains how to separate predicting churn from proving that an intervention prevents it.
How does the calculation change for ecommerce?
For non-subscription ecommerce, measure contribution from repeat orders over a fixed horizon instead of assigning a subscription churn rate to irregular buying. Define the first-order cohort and include every acquired customer, including those who never order again.
Consider a hypothetical twelve-month cohort of 500 first-time buyers with USD 25,000 in allocated acquisition expense. Assume the full window is complete and all amounts are USD, excluding sales tax.
| Component | Twelve-month amount | Treatment |
|---|---|---|
| Order revenue before refunds | 80,000 | Include orders from the original customers only |
| Customer refunds | 5,000 | Reduce revenue once |
| Product cost, net of inventory recoveries | 40,000 | Deduct the defined cost of goods |
| Fulfillment and payment costs | 11,000 | Deduct these customer-related variable costs |
| Cohort contribution | 24,000 | 80,000 − 5,000 − 40,000 − 11,000 |
| Contribution per acquired buyer | 48 | 24,000 / 500 |
| Acquisition cost per buyer | 50 | 25,000 / 500 |
| Twelve-month contribution/CAC | 0.96 | 24,000 / 25,000 |
The cohort has not recovered its acquisition expense on this stated contribution basis within twelve months. Later purchases could change that result, but they belong in a future observation or a separately labelled forecast. Do not substitute total lifetime orders from older customers for the new cohort's expected repeat behavior.
Separate acquisition and retention spending under one policy. If a repeat-purchase campaign's cost is deducted from contribution, do not also add it to initial CAC. The marketing ROI guide connects the resulting contribution to the broader spending decision.
What should pass before the ratio reaches a board deck?
Approve the metric when its population, costs, horizon and forecast assumptions can be reproduced. A high result should receive the same checks as a low one.
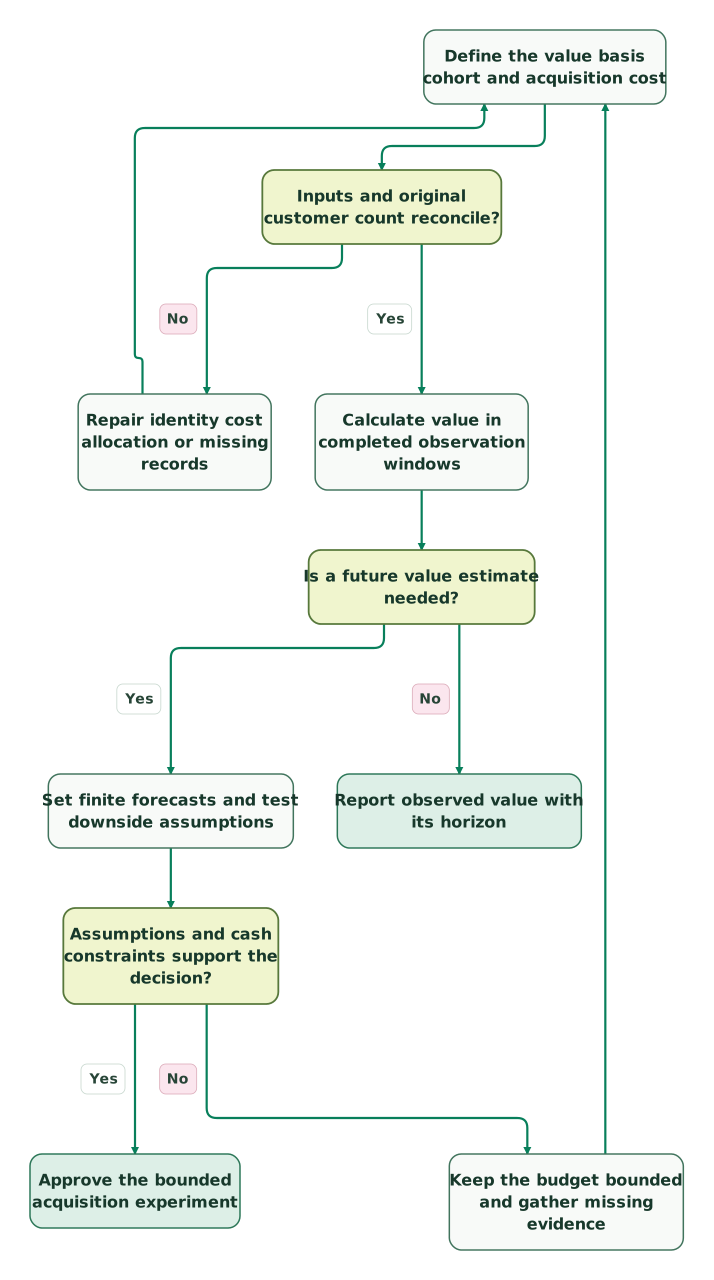
Read diagram as text
- Define the value basis cohort and acquisition cost to Inputs and original customer count reconcile?.
- Inputs and original customer count reconcile? to Repair identity cost allocation or missing records: No.
- Repair identity cost allocation or missing records to Define the value basis cohort and acquisition cost.
- Inputs and original customer count reconcile? to Calculate value in completed observation windows: Yes.
- Calculate value in completed observation windows to Is a future value estimate needed?.
- Is a future value estimate needed? to Report observed value with its horizon: No.
- Is a future value estimate needed? to Set finite forecasts and test downside assumptions: Yes.
- Set finite forecasts and test downside assumptions to Assumptions and cash constraints support the decision?.
- Assumptions and cash constraints support the decision? to Keep the budget bounded and gather missing evidence: No.
- Keep the budget bounded and gather missing evidence to Define the value basis cohort and acquisition cost.
- Assumptions and cash constraints support the decision? to Approve the bounded acquisition experiment: Yes
Checklist
- The numerator says revenue, gross profit or contribution, with its cost scope.
- CAC reconciles to the approved pool, including unsuccessful effort.
- The original acquisition cohort remains intact after churn, expansion or CRM merges.
- The observation horizon and completed months are explicit.
- Actual value and the future forecast are shown separately.
- Monthly and annual rates use consistent periods and timing.
- The benchmark uses a comparable value and cost basis.
- Expansion and concentrated customer contributions remain visible.
- Payback and the cash needed to fund the experiment are reviewed separately.
- The next acquisition test has an owner, scope and stopping rule.
If acquisition spend, customer identity and billing still produce conflicting ratios, bring one cohort to the $99 martech audit. The useful output is a model the team can reproduce, together with the particular assumption that needs evidence before the next spending decision.
Keep reading
Browse all Product Analytics guides
 Product Analytics
Marketplace Metrics: Liquidity, GMV and the Data Behind Them
Calculate marketplace liquidity, take rate and CAC by side. Includes event contracts, a tested search-to-booking query and a refund reconciliation example.
Jafrin Akter AloLast updated 18 min read
 Product Analytics
CAC Payback Period: Formula, Benchmarks and a Worked SaaS Example
Calculate CAC payback with the SaaS formula, gross margin and cohort data. See what a good payback period is by segment and when the number misleads.
Jafrin Akter AloLast updated 17 min read
 Product Analytics
Net Revenue Retention: Calculate It From a Consistent Customer Cohort
Calculate net revenue retention from a fixed customer cohort, read it beside gross retention, and compare it with sourced SaaS benchmarks by size and ACV.
Jafrin Akter AloLast updated 15 min read
Data warehouse & CDP
See the implementation scope, deliverables and acceptance checks.
Questions people ask
Should a negative revenue churn rate go into the simple LTV denominator?
No. The simple survival formula uses customer churn, while net revenue churn includes expansion and can be negative. Dividing by a negative revenue-churn figure does not produce a meaningful customer lifetime. Model retained customers and their changing contribution separately, use a finite horizon and preserve the actual expansion revenue and costs from the original acquisition cohort.
How should an unusually large customer affect a cohort's lifetime value?
Keep the customer's actual value in the cohort, then show concentration alongside the average. Report how much contribution comes from the largest accounts and whether the conclusion changes without one unusually large expansion. That sensitivity does not justify deleting successful customers; it shows whether the acquisition strategy depends on outcomes that the next cohort may not repeat.
Can a new cohort use the lifetime value of an older cohort?
Use the older cohort as an explicit planning reference only after comparing its entry price, customer size, acquisition path, product and serving costs. Preserve those differences rather than copying the final ratio. Freeze the new cohort's forecast at acquisition, then compare its actual value at the same reporting age. The older result is evidence for assumptions, not an observation of the new customers.
What should happen when a late refund changes a previously reported cohort value?
Apply the refund and associated cost adjustment under the agreed reporting policy, then retain a bridge from the earlier value to the revised one. Keep the customer in its original cohort and check whether the refund was already included in another reduction. A lower revised ratio can reflect corrected financial evidence without any change in the cohort's original acquisition spending.
How often should the team update its LTV to CAC model?
Refresh completed cohort windows on a regular reporting cadence and revise assumptions when pricing, acquisition mix, serving costs or retention evidence changes materially. Preserve each forecast version and its original inputs. Updating the model should help explain the difference between new customer evidence and a changed definition, rather than quietly replacing the number used to approve an earlier budget.
Sources

Written by
Jafrin Akter AloData Engineer and Co-founder at Martechdevs and Growth and Analytics Partners
Jafrin writes practical guides to marketing technology, customer data, analytics and AI workflows. Martechdevs is a Growth and Analytics Partners company.