
Marketing attribution models explained for small teams
Data Engineer and Co-founder, martechdevs
Last updated 10 min read
A marketing attribution model decides how to distribute credit for a measured outcome across eligible interactions. It helps you describe customer paths and operate campaigns. Choosing a more complicated model does not recover missing interactions or prove how many sales would disappear without a channel. For a small team, the useful starting point is one clear business outcome, reliable collection and a documented view of credit that everyone can reproduce.
Last updated: 18 September 2026.
Define the outcome before arguing about the model
If paid media counts form submissions, sales counts qualified opportunities and finance counts paid customers, changing attribution weights cannot reconcile the reports. Agree on the outcome, population, time basis and value first.
For ecommerce, distinguish an order from a new customer and gross order value from revenue after adjustments. For SaaS, distinguish a person signing up from a workspace activating and an account paying. A buyer can submit three forms and still represent one sales opportunity.
Keep diagnostic stages available, but name them separately. A campaign can produce cheap registrations and expensive customers. You need that distinction to assess lead quality rather than rewarding whichever team owns the largest count. The key-events and conversion guide explains how these outcomes connect to GA4 reporting and advertising goals.
Then define what the model can observe. A path assembled from browser sessions may omit an earlier podcast, a colleague's recommendation or an offline conversation. Calling the first retained interaction “first touch” does not make it the customer's first exposure to the business.
See the models on one path
Consider this invented path for a single $1,200 purchase. Assume the same buyer is consistently identified, every listed interaction is retained, the lookback includes the whole path, and the four marketing interactions qualify for credit:
- Day 0: the buyer arrives through organic search.
- Day 7: the buyer clicks a paid social ad.
- Day 14: the buyer clicks a lifecycle email.
- Day 21: the buyer clicks a paid brand-search ad.
- Day 22: the buyer returns directly and purchases.
The business outcome stays $1,200 under every allocation below. Only the credit changes. These are transparent illustrative rules, not a claim that every platform offers all of them.
First touch
Give the entire $1,200 to organic search, the first eligible observed interaction. This answers an acquisition-origin question and is easy to explain.
It also ignores everything that happened after discovery. A team using it to judge closing activity would systematically miss the role of later messages. Record how far back the data goes and whether the first observed interaction happened after an identity reset.
Last touch and last non-direct touch
A literal last-touch rule gives the full amount to the final direct visit. A last non-direct rule skips that visit and gives $1,200 to paid brand search.
These are different definitions. Never put “last click” on a dashboard without documenting direct-traffic handling and which interactions qualify. The last observed marketing interaction can be valuable while also benefiting from demand created earlier.
Linear
Split credit evenly across the four eligible marketing interactions: $300 each to organic search, paid social, email and paid brand search.
The arithmetic is transparent, but equal weight is an assumption. It does not establish that every interaction contributed equally. Also specify whether you allocate per interaction or per channel. Three emails and one search click receive different totals under those two implementations.
Position based
In this illustrative 40/20/40 rule, the first and last eligible interactions receive 40% each. The middle interactions share the remaining 20%.
Organic search receives $480, paid social $120, email $120 and paid brand search $480. Those weights express a preference for discovery and closing. They are not a measured fact about this customer.
Write explicit rules for one-interaction and two-interaction paths. Without them, a model that works neatly on a presentation slide can lose or duplicate credit in the actual dataset.
Time decay
Give greater weight to more recent eligible interactions. For a seven-day half-life and this path's seven-day spacing, the relative weights are 1, 2, 4 and 8. Normalising them to the $1,200 purchase allocates $80, $160, $320 and $640 respectively.
The half-life is a modelling choice, not the length of your customer's buying process. A short half-life can heavily discount early education in a long sales cycle. A different interval changes the allocation without changing a single sale.
Data driven
A data-driven model estimates weights from available data instead of using the fixed rules above. Google's attribution documentation describes analysing converting and non-converting paths and assigning fractional credit. Its methodology also uses experimental evidence in estimating some effects.
You cannot calculate Google's actual allocation from this one path alone. Do not invent percentages and label them a real data-driven result. The weights depend on the model, its eligible evidence and the broader data available to it.
A model informed by causal methods still does not substitute for a well-designed test of your specific proposed budget change. Distinguish the platform's estimation method from an experiment your business actually ran.
Know what the current platforms mean
GA4
GA4's documentation lists data-driven, paid and organic last click, and Google paid channels last click in its attribution reporting. First-click, linear, time-decay and position-based models were removed from GA4's available attribution models in November 2023. They remain useful concepts and can be implemented elsewhere; they are not current GA4 menu instructions. Google's model overview explains the distinction and its direct-traffic treatment.
Also check the report's dimension scope. Event-scoped traffic dimensions use the selected reporting attribution model, with data-driven as the default. First-user and session-scoped traffic dimensions have their own acquisition meaning and are unaffected by a reporting-model change. See Google's traffic-source scope documentation.
This explains why changing the model does not automatically change every acquisition report. Save the dimension, outcome metric and model together. Comparing Session source with an event-scoped attribution result without that context is a comparison of different questions.
Google Ads
Google describes data-driven as the default for most conversion actions in its attribution-model guide. “Most” is a reason to inspect the action, not assume every existing account uses that setting.
Record the action's source, counting rule, window and model, plus whether the campaign actually uses the goal for bidding. A reporting-model comparison is different from changing a campaign's operational conversion configuration. Review likely effects before changing settings that influence optimisation.
Meta
Record the account's actual attribution setting and the interaction types and windows it includes. Avoid describing Meta's output as a universally equivalent cross-channel last-click report.
Meta announced changes in March 2026 that narrow click-through attribution for website and physical-store conversions to link clicks, with other social interactions moving to engage-through attribution. Its measurement announcement describes a rollout, so definitions can differ across historical reporting periods.
A fixed “default window” copied from an old article is weak evidence of how a particular report was produced. Use saved account settings and export parameters. The Meta and GA4 reconciliation guide covers the collection, identity and reporting differences in more detail.
Build one reproducible business view
A small team does not need a warehouse simply to calculate a last-touch rule. A carefully maintained export can establish the logic. Use a marketing data warehouse when recurring joins, history, scale or operational outputs justify it.
The business view needs separate records for outcomes, interactions and allocated credit. Keep the original order or account outcome once. A credit record links it to a touchpoint or channel with a weight and model version.
Test these invariants:
- Each eligible outcome appears once in the outcome dataset.
- Each eligible interaction occurs before the outcome and inside the defined window.
- The permitted identity mapping connects the interaction to the intended entity.
- Weights sum to one for every outcome allocated by a full-credit model.
- Unattributed outcomes remain visible, including their count and value.
- Credit totals reconcile to the included business outcomes in the same currency.
Do not remove unattributed outcomes from the denominator to improve a channel chart. If 70 of 100 new customers have an observable path, describe the attribution coverage as 70%. The remaining 30 still belong in acquisition-cost and business-performance reporting.
For B2B, decide whether the unit is contact, opportunity or account. Two colleagues can interact with marketing before one account buys. Do not multiply one contract's revenue across both contact paths. The GA4–HubSpot reporting walkthrough shows how to prevent this join error. Record account membership and its effective dates, and distinguish known membership from a guessed company match.
Write the rules down before running the query
Use a compact contract like this illustrative example. Its 30-day window is a chosen reporting rule, not a recommendation for every business or a description of a vendor default.
model_version: new_order_last_non_direct_v1
outcome: first_paid_order_per_customer
time_basis: payment_timestamp
reporting_timezone: UTC
lookback_days: 30
eligible_touchpoints: recorded_non_direct_clicks
identity_rule: verified_customer_link_only
allocation: last_eligible_touchpoint
no_eligible_touchpoint: unattributed
value_basis: item_value_after_discounts_before_tax_shipping
currency_handling: separate_totals_by_currency
renewals_and_repeat_orders: separate_report
Keep first observed acquisition alongside the primary allocation if it answers a useful question. That does not mean adding first-touch and last-touch credit together. They are alternative views of the same outcomes.
Version changes in the contract and distinguish two reporting modes: restating history under a new rule, or preserving historical snapshots under the rule used at the time. Either can be useful. Quietly mixing them makes trends difficult to interpret.
Choose a model for the decision it supports
For finding where new audiences first enter your measurable journey, use a first-observed acquisition view and state its visibility limits. For reviewing the last observable route into conversion, use a documented last eligible interaction view. For operating an advertising campaign, use the platform's relevant reporting and bidding configuration.
For a large cross-channel budget change, use attribution to identify a hypothesis, then assess causal evidence. A channel receiving the last click may be capturing existing intent. A channel with little click credit may be creating demand elsewhere. Neither explanation is proven by the allocation alone.
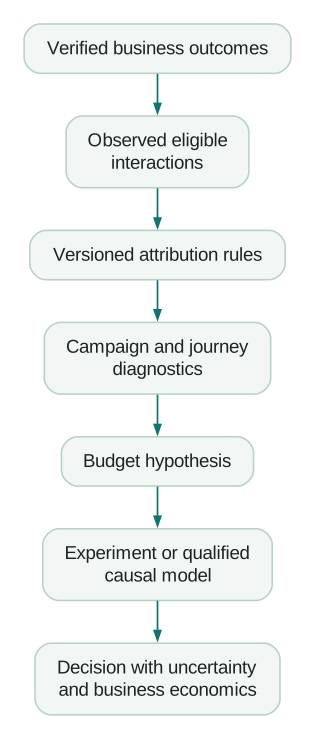
The distinction matters financially. Suppose $5,000 of spend receives $20,000 of attributed revenue. Attributed ROAS is 4.0. That does not tell you whether the spend created $20,000 of additional revenue, nor whether the resulting contribution covered media and operating costs.
If a credible experiment instead estimates $8,000 of additional revenue, incremental ROAS is 1.6 for that tested comparison. At a 60% contribution margin before media, that represents $4,800 of contribution against $5,000 of media, or a $200 shortfall before other incremental costs. These are invented figures illustrating why the definition changes the decision.
For method selection, use the attribution, MMM and incrementality guide. It explains when a controlled test or aggregate model can answer a question that click allocation cannot.
Use model disagreement to investigate
Compare two understandable views on the same outcome population. If organic search dominates first touch but paid brand search dominates last non-direct touch, investigate the paths and customer evidence. Do not automatically split the budget evenly between the two charts.
Check how the result changes when you separate new and returning customers, shorten or lengthen the window, inspect unmatched outcomes, and distinguish brand from non-brand demand. Keep the business definition fixed while changing one analytical assumption at a time.
Ask customers an optional, open question about how they found you and preserve the original answers. That can surface referrals, communities and offline influences missing from click data. Treat it as customer-reported evidence with recall and response bias, not a precise replacement attribution ledger.
If the preferred budget decision reverses under plausible assumptions, the uncertainty is material. Choose a smaller reversible test or collect stronger evidence instead of presenting one model's decimal places as certainty.
A practical acceptance checklist
- The report names one outcome and its business unit.
- New customers, repeat purchases and funnel stages are separated deliberately.
- The observation window, identity rule and eligible interactions are documented.
- Direct and unattributed outcomes have explicit treatment.
- Credit reconciles to the outcome total without multiplying contracts or orders.
- Platform reports retain their own source, window and scope labels.
- Model changes are versioned and historical treatment is clear.
- Revenue credit is not presented as profit or proven incremental revenue.
- The next budget decision has an appropriate evidence requirement.
An analytics and tracking engagement should establish these definitions and repair missing or repeated collection. When the work requires recurring cross-system reconciliation, a warehouse implementation can make the view repeatable. Buy the capability needed for the decision, with an acceptance check you can inspect.
Questions people ask
Which attribution model should a startup use?
Start with a transparent view that fits the question and the data you actually retain. Keep first observed acquisition and last eligible interaction distinct, use platform metrics for campaign operation, and use causal evidence for material spend decisions. Complexity is justified when it improves a recurring decision.
Can I still select linear attribution in GA4?
No. GA4 removed linear, first-click, time-decay and position-based attribution models in November 2023. You can still calculate a clearly labelled version outside GA4, but it is not a current GA4 reporting-model option.
Is data-driven attribution the same as incrementality testing?
No. A data-driven attribution system estimates how to allocate credit using its available evidence and methodology. Some methods incorporate experimental information. That does not mean your specific budget proposal has been tested with an appropriate treatment, control and business outcome.
Can I add platform-attributed conversions together?
Not as a distinct customer total. Different platforms can credit overlapping outcomes. Use a deduplicated business denominator and keep each platform's attributed metric labelled separately.
Do I need a warehouse to start?
No. Begin with a reproducible outcome extract, observed interactions and documented rules. A warehouse becomes useful when maintaining those joins and histories manually costs too much or cannot support the required checks and recurring decisions.
Sources
Written by
Jafrin Akter AloData Engineer and Co-founder, martechdevs
Jafrin Akter Alo is a data engineer and co-founder of martechdevs, where the team has delivered 74+ martech, data and growth stack implementations.