
How to Measure Marketing ROI Without Letting Tracking Fool You
Data Engineer and Co-founder, martechdevs
Last updated 12 min read
Measure marketing ROI by comparing the contribution a marketing investment adds with the full cost of that investment. Define the outcome, cost boundary, time period and evidence for incrementality before calculating the percentage. ROAS, customer acquisition cost and payback answer related questions, but none is a substitute for that definition.
Last updated: 23 September 2026.
The difficult part is rarely division. It is deciding which sales marketing actually caused, which costs belong in the calculation and whether the customers have had enough time to produce the value being claimed.
A dashboard can return a precise number while getting all three wrong. This guide gives you explicit formulas, two worked examples, a spreadsheet setup and a practical reporting process. All financial examples are hypothetical.
Write the measurement contract before the formula
Start with the decision you need to make. “Should we increase this campaign's budget next quarter?” needs a different analysis from “Did the customer acquisition program repay its costs over the last year?”
Record these choices alongside the report:
- The investment being evaluated: one campaign, a channel, acquisition, retention or the whole marketing function.
- The business outcome: net sales, contribution, paying customers or another defined result.
- The comparison: what would likely have happened without that investment or with the alternative allocation.
- The cost boundary: media only, directly attributable marketing costs or a broader allocation.
- The population and horizon: which customers, markets and dates are included.
- The evidence: source records, attribution rules, experiment or model, with uncertainty.
A campaign can be worth continuing at its incremental cost while failing to cover a broad allocation of company overhead. That is not necessarily a contradiction. It means the two calculations answer different decisions. Name them accordingly.
Use a consistent finance-approved treatment for currency, refunds, discounts and relevant taxes. Do not compare gross checkout value in one channel with net recognized revenue in another.
The marketing ROI formula used in this guide
For a defined marketing investment, use:
Marketing ROI = (incremental contribution before marketing cost − marketing investment) ÷ marketing investment.
Multiply by 100 to express it as a percentage. Here, incremental contribution means additional net revenue attributable to the intervention after the relevant product and service delivery costs, before the marketing costs being evaluated.
This avoids subtracting those same marketing costs twice. If your contribution measure already deducts them, use a reconciled net-benefit numerator instead.
For example, $45,000 of additional contribution against $30,000 of marketing investment produces $15,000 of net benefit and a 50% marketing ROI. This percentage uses marketing investment as its denominator.
There is no guarantee that another report uses that convention. Google Ads' ROI help example divides profit by combined production and advertising costs. The denominator therefore differs from the marketing-investment formula above. Google Ads ROI definition
Meridian, Google's marketing mix modeling framework, calls incremental outcome divided by media spend “ROI”; the outcome can be revenue. That is not automatically a net-profit percentage. Meridian metric definitions
Do not argue about which label wins. Put the numerator and denominator on the page, and reconcile them before presenting a comparison.
ROAS measures advertising value relative to media spend
Revenue ROAS = attributed revenue ÷ advertising spend.
If an ad platform reports $100,000 of revenue against $20,000 of media spend, reported revenue ROAS is 5x, or 500%. This calculation has not deducted product costs, agency fees, creative production or salaries.
Google's Target ROAS uses reported conversion value relative to cost. That value need not be actual revenue: it can reflect the conversion values you configure. Inspect the value definition before treating the platform's number as a sales return. Google Target ROAS documentation
A lead assigned a $200 value is not a collected $200 payment. A modeled expected value can be useful for bidding if justified and maintained, but the financial report should preserve its status as an estimate.
ROAS is useful for operating a campaign under a consistent measurement setup. It does not by itself tell you whether the whole acquisition program is profitable or whether the reported sales would have happened anyway.
A 5x ROAS example that can still lose money
Consider a fictional campaign with these costs:
- Media: $20,000.
- Creative: $3,000.
- Agency delivery: $2,000.
- Allocated internal marketing work: $4,000.
- Relevant marketing tools: $1,000.
Total marketing investment is $30,000. Assume the attributed revenue, already adjusted for discounts and refunds, is $100,000. Relevant product and fulfillment costs leave a 45% contribution margin before marketing.
On an attributed basis, the revenue produces $45,000 of contribution. Subtracting the $30,000 marketing investment leaves $15,000, giving an attributed contribution ROI of 50%.
Now suppose a credible incrementality analysis estimates that only $60,000 of the revenue was additional because of the evaluated marketing investment. Under the same margin assumption, incremental contribution is $27,000. After the $30,000 investment, the net result is negative $3,000, or −10% incremental marketing ROI.
This is an illustrative change in assumptions, not a measured campaign result. It shows why the conclusion depends on causal evidence as well as accurate accounting.
At that 45% margin, the project needs approximately $66,667 of incremental net revenue to cover $30,000 of marketing cost. The exact threshold is $30,000 divided by 0.45.
Relative to $20,000 of media spend, that is roughly 3.33x incremental revenue per media dollar when the additional $10,000 marketing cost is included. Considering media alone would produce a lower 2.22x threshold. Neither is a universal “good ROAS,” and an attributed platform ratio is not interchangeable with the incremental ratio.
Build the calculation in Excel or Google Sheets
Use column A for the labels below and column B for their numeric values. Enter percentage assumptions as percentages, and keep all monetary amounts in one currency.
- B2: media spend, 20000.
- B3: other included marketing cost, 10000.
- B4: attributed net revenue, 100000.
- B5: estimated incremental net revenue, 60000.
- B6: contribution margin before marketing, 45%.
Then add these formulas:
- B8, total marketing cost:
=B2+B3 - B9, reported revenue ROAS:
=IF(B2>0,B4/B2,NA()) - B10, attributed contribution ROI:
=IF(B8>0,(B4*B6-B8)/B8,NA()) - B11, incremental contribution ROI:
=IF(B8>0,(B5*B6-B8)/B8,NA()) - B12, break-even incremental revenue:
=IF(B6>0,B8/B6,NA())
Format B10 and B11 as percentages; do not multiply by 100 as well as applying percentage formatting. B9 is a multiple: 5 means 5x.
The NA() branches make an undefined denominator visible. A zero marketing investment does not produce a meaningful ROI ratio, and a nonpositive contribution margin cannot produce this positive-spend break-even threshold.
The formulas do not estimate B5 for you. Attach the method and range behind incremental revenue. Keep an unadjusted attributed view visible if useful, but do not relabel it incremental merely because it is in the same spreadsheet.
CAC and payback explain acquisition efficiency and timing
Customer acquisition cost, or CAC = included acquisition cost ÷ new paying customers acquired.
Define “new” at the right unit. Five seats inside one newly acquired B2B account are not necessarily five new customers. Exclude renewals and reactivations unless the metric is explicitly intended to include them.
State whether CAC is media-only, marketing-only or fully loaded sales and marketing CAC. Include the relevant acquisition salaries, commissions, tools and service costs for the chosen definition. Separate retention work where a reasonable allocation is possible, and make the allocation rule visible.
For a simple stable subscription case:
CAC payback in months = CAC ÷ monthly contribution per customer.
Stripe's payback guide similarly relates acquisition cost to the monthly profit generated per customer. Stripe CAC payback guidance
Suppose a separate fictional SaaS acquisition cohort costs $90,000 and brings 150 new paying accounts. CAC is $600. At $120 monthly revenue and an 80% contribution margin before acquisition cost, monthly contribution is $96. The simplified payback is 6.25 months.
That calculation assumes stable contribution and continuing customers. At monthly measurement points, six months provides $576 per original customer; seven provides $672. Churn, expansion, onboarding costs and changing usage can alter the actual path.
For a more useful cohort view, accumulate contribution from that original cohort month by month, including the effect of customers who leave. Find when cumulative contribution covers the cohort's acquisition cost. Do not average only the remaining customers and pretend the lost customers had no acquisition cost.
Annual prepayment also changes cash timing. Keep contribution payback distinct from cash collected and from accounting revenue recognition. A large upfront receipt does not eliminate future service obligations.
Use LTV carefully when customers are still young
Lifetime value is a forecast when much of the customer's life has not happened yet. A strong-looking LTV:CAC ratio can hide optimistic retention assumptions or a long wait for cash.
In a deliberately simplified model with constant $96 monthly contribution and constant 4% monthly churn, expected undiscounted contribution over an unlimited horizon is $96 divided by 0.04, or $2,400. Against $600 CAC, that gives 4x LTV:CAC.
This geometric model assumes a full initial contributing month, unchanged churn and margin, no expansion and no discounting. It is not an observed $2,400 return. A small early cohort, contract renewals concentrated on anniversaries or changing product economics can make those assumptions unsuitable.
Report observed contribution to date separately from forecast future contribution. Show retention by cohort and the effect of a less favorable assumption. When history is short, a bounded 12-month contribution forecast may be more honest than an impressive lifetime multiple.
Fix the tracking inputs before trusting the ratios
A purchase count should reconcile to a defined business event. Decide how to handle cancellations, partial refunds, test orders, duplicate deliveries and failed payments. Preserve stable order and customer identifiers across the systems involved.
Google Analytics documents separate purchase and refund events connected through the transaction ID. A purchase implementation alone is not evidence that later refunds are reflected in your reporting. GA4 ecommerce measurement
Check currency and units. A value transmitted in cents while interpreted as dollars can make a campaign appear extraordinarily profitable. So can sending a contract's total value as though it were the period's realized revenue without labeling it.
Attribution settings also change the eligible touchpoints. GA4's lookback-window documentation explains that the window controls how far back an interaction can receive credit. A longer window changes measurement scope; it does not manufacture more business revenue. GA4 lookback windows
Do not add channel dashboards together as if their claims were exclusive. Two platforms can take credit for the same order. Use reconciled business totals, then explain how each analytical view allocates or estimates effects.
The marketing attribution models guide helps select a reporting convention. The Google Ads conversion-diagnostics guide helps investigate a broken collection or matching stage.
Match the time window to how the business earns money
A monthly spend report and a monthly revenue report are not automatically a matched cohort. This month's closed deals may come from marketing and sales work performed several months earlier.
Use a period view to manage current spending and financial performance. Use a cohort view to understand how customers acquired through a particular investment mature. Reconcile the views without pretending they should always produce the same answer.
For B2B, keep pipeline separate from revenue. Opportunity amounts multiplied by an assumed win rate produce expected pipeline value, not realized ROI. Validate those probabilities against relevant historical cohorts and update for qualification changes.
For content and lifecycle programs, include recurring production, distribution and maintenance work. Do not assign an entire multi-year customer relationship to the last article or email simply because it was the final measured touch.
Specify a provisional reporting date and a later mature view when returns arrive slowly. Avoid changing definitions after seeing which version flatters the campaign.
Choose the evidence needed for the budget decision
Attribution describes how observed outcomes receive credit. A controlled incrementality study estimates the effect of an intervention under its design and assumptions. Marketing mix modeling estimates effects from aggregated data and modeling assumptions. They can inform one another but are not interchangeable.
For a budget change, define the treatment precisely: a channel on versus off, a higher spend level or a different allocation. Keep outcome detection comparable across the groups. Consider spillovers, delayed effects and whether the sample can detect an effect large enough to change the decision.
A before-and-after comparison is vulnerable to seasonality, pricing changes, product releases and sales effort. Explain those limitations instead of giving the result a causal label. The attribution, MMM and incrementality comparison sets out when each approach helps.
Historical average return also differs from the return on additional spend. Increasing a channel's budget can reach a less responsive audience or raise acquisition costs. Meridian explicitly distinguishes average and marginal ROI and warns about extrapolating beyond observed spending. Use any model's response curve within the limits of its data, not as a guaranteed growth schedule.
Give finance a connected set of metrics
Gartner's 2024 survey of 378 senior marketing leaders found that respondents using at least two of its more complex metric categories were up to 1.8 times as likely to prove value and receive credit as those using none. Those categories covered customer relationships, transactional returns and operations. This is an association from a survey, not evidence that adding dashboard tiles causes financial success. Gartner's measurement survey
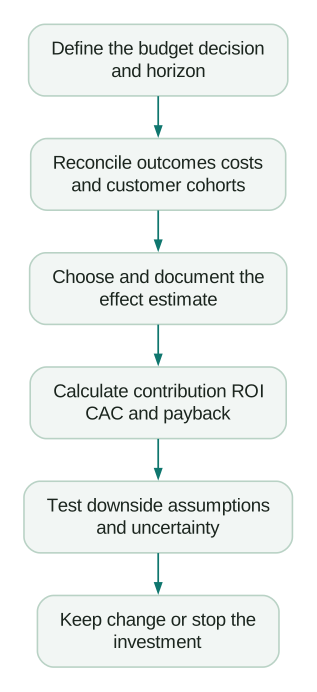
A practical report connects four things: how much was invested, what contribution it produced or is expected to produce, how quickly the acquisition cost is recovered and what action the evidence supports.
Add operating indicators that explain the result, such as qualified-request volume, activation, retention and measurement coverage. They help diagnose performance. They are not extra monetary benefits to add on top of the contribution already counted.
Marketing ROI review checklist
- The decision, customer population and measurement horizon are explicit.
- Revenue, contribution, costs and currency use consistent definitions.
- Marketing costs are included once and match the stated denominator.
- Refunds, duplicates, test transactions and customer identity are reconciled.
- Attributed, modeled, experimental and realized results are labeled accurately.
- Cohorts have enough time to mature, or forecasts are shown separately.
- CAC, contribution payback and cash timing are not conflated.
- Downside assumptions and uncertainty can change the recommendation.
- The next action and the person responsible are recorded.
If the business records and marketing reports cannot yet support this calculation, start with analytics and tracking implementation. Bring the decision and the reconciliation gap. A cleaner input model is more useful than another dashboard displaying an unexplained ROI percentage.
Questions people ask
How do I calculate marketing ROI?
Define the investment and estimate the incremental contribution it creates before marketing cost. Subtract the included marketing cost, divide by that same cost and express the result as a percentage. State the horizon, cost boundary and evidence behind the incremental outcome; other sources may use different ROI definitions.
What is a good marketing ROI?
There is no universal percentage. The required return depends on margin, risk, timing, cash constraints and alternative uses of the money. Calculate your break-even threshold, include the full chosen cost scope and test whether the expected return remains acceptable under a plausible downside.
What is the difference between ROI and ROAS?
Revenue ROAS divides attributed revenue by ad spend. It normally does not deduct product costs or the rest of the marketing budget. A contribution-based marketing ROI includes relevant margin and marketing costs; its incremental version also requires evidence about outcomes caused by the investment.
Can I calculate marketing ROI in Excel?
Yes. Use separate inputs for media, other included costs, attributed revenue, incremental revenue and contribution margin. Keep the causal estimate outside the arithmetic formula, handle zero denominators visibly and format ratios consistently. The worked cell layout in this guide reproduces the example.
Which metrics should I show a CFO?
Show the investment, contribution return, acquisition cost, payback timing and uncertainty needed for the decision. Reconcile them to business records and distinguish observed results from forecasts. Add operational metrics only where they explain what to change or whether the forecast is being realized.
Sources
Written by
Jafrin Akter AloData Engineer and Co-founder, martechdevs
Jafrin Akter Alo is a data engineer and co-founder of martechdevs, where the team has delivered 74+ martech, data and growth stack implementations.