
Cohort Retention Analysis: Choose Definitions That Support Decisions
Data Engineer and Co-founder, martechdevs
Last updated 10 min read
Cohort retention analysis measures whether the same users or accounts return to perform a meaningful action after a defined starting event. A useful analysis fixes the cohort entry rule, return behavior, time window, denominator and observation cutoff. Without those choices, two charts labelled “Day 7 retention” can disagree while both calculations are internally correct.
Last updated: 22 September 2026.
Start with the decision the chart must support
A founder asking whether new customers keep receiving value needs a different view from a lifecycle manager deciding when to send a reminder. The first may need monthly account retention after activation. The second may need the distribution of time between meaningful uses.
Choose a return event that represents the product's job. Opening a reporting application can be useful, but generating or reviewing a valid report is stronger evidence of value. A background heartbeat should not make an inactive customer look retained. Equally, a product that successfully automates a workflow may deliver value without a daily login.
Write the question as a sentence: “Of workspaces that produced their first valid report in September, what proportion produced another valid report during days 7–13 after that first success?” That sentence specifies the population, unit, behavior and interval before anyone chooses a chart setting.
A product analytics setup should make these definitions reproducible. Save the event contract and model version with the report, so a change in event meaning does not look like a sudden improvement in customer behavior.
Keep signup retention and activated-customer retention as separate measures. The latter excludes people who never reached activation. That can be the right population for studying repeated value, but it cannot tell the whole acquisition-to-value story. Pair it with SaaS activation metrics rather than letting a healthy activated cohort hide an onboarding failure.
Fix who enters the cohort and when
An acquisition cohort usually contains each unit once, based on its first qualifying event. A recurring-use cohort can contain a unit in multiple entry periods. Both are valid, but they answer different questions.
“First event in the selected date range” is also different from “first event ever.” Someone who used the product last year can look new if the report only looks back to the beginning of this month. If historical data is incomplete, describe the cohort as first observed since the available-history date rather than confidently calling it newly acquired.
PostHog's retention documentation distinguishes first-time-in-range, first-ever and recurring entry options. That illustrates why a tool's convenient label is not a sufficient metric definition.
Decide whether the unit is a person, workspace, customer account or subscription. A workspace can remain active after its original champion leaves. User retention may decline while account retention stays stable. For a collaborative B2B product, inspect both when the decision concerns adoption depth and renewal risk.
Use stable IDs with explicit merge handling. If two identities later become one customer, document whether historical cohorts are restated. Do not silently merge unrelated workspace IDs because they share an email domain. An identity resolution model should preserve the relationship between observed actors and business accounts.
Choose the return rule before choosing a benchmark
Exact-period retention asks whether a unit returned within a particular interval. On-or-after retention asks whether it returned at or after the interval's lower boundary, within the available observation horizon. Consecutive-period retention asks whether it returned in every required interval.
Amplitude's retention interpretation guide distinguishes Return On, Return On or After and custom brackets. A custom bracket can be useful for a weekly product whose users return on different weekdays.
Consider ten synthetic users, A through J, all first active on the same date and fully observed through the end of day 27. Their meaningful return days are:
- A: days 7 and 14.
- B: day 7.
- C: day 8.
- D: day 14.
- E: day 21.
- F: no return.
- G: days 1 and 2.
- H: day 6.
- I: day 27.
- J: no return.
Exact day-7 retention is 2/10, or 20%, because only A and B return on day 7. Retention in the bracket days 7–13 is 3/10, or 30%, because C also qualifies. On-or-after day 7, observed through day 27, is 6/10, or 60%: A, B, C, D, E and I.
For consecutive weekly return, use three non-overlapping intervals: days 7–13, 14–20 and 21–27. Nobody returns in all three, so that particular consecutive-retention measure is 0%. The product did not change between these calculations. The question did.
Do not compare your 60% on-or-after result with another company's exact-day benchmark and infer superiority. First establish whether the unit, start event, return event, window and audience are comparable. Often they are not.
Define what a day or week means
A person who starts at 23:50 and returns at 00:10 has returned on the next calendar date, but only 20 minutes later. A calendar-day definition can count that as next-day activity; an elapsed 24–48-hour window will not.
Amplitude's time documentation describes calendar and rolling-window approaches, including implementation details such as timestamp rounding. When reproducing a vendor result, match those details rather than assuming every tool uses exact timestamp subtraction.
For your own model, specify half-open intervals to avoid double counting boundary events. For example, elapsed week 1 can mean at least 7×24 hours and less than 14×24 hours after entry. An event exactly at 14 days belongs to week 2. The earlier synthetic day-offset example uses this convention.
Calendar weeks need a timezone and a first weekday. A Monday-start business reporting week and a Sunday-start application default produce different cohorts at the boundary. Daylight-saving changes also make calendar days different from fixed 24-hour durations in some timezones.
Choose the convention that supports the product's cadence. A payroll workflow may follow calendar periods, while a trial follow-up can be evaluated against elapsed time since activation. Record both the human-readable rule and the timestamp logic in the metric contract.
Keep immature cohorts out of final comparisons
A customer who signed up three days ago has not had a chance to return on day 7. Counting that customer as a day-7 failure biases the result down. Calling the cell missing is more honest than filling it with zero.
For exact day 7 under an elapsed-time definition, a unit needs to reach the end of its day-7 window before the result is mature. For a days 7–13 bracket, it needs the full bracket. Also allow the agreed ingestion delay before declaring the data complete.
On-or-after retention requires particular care. A September cohort has had more opportunities for a late return than an October cohort. For a fair comparison, use a common observation horizon, such as “returned during days 7–27,” and include only cohorts fully observed through day 27. Label that bounded measure explicitly rather than implying an infinite future.
Mixpanel's retention documentation explains incomplete buckets and the distinction between return criteria. Check the actual configuration and exported counts when comparing a tool's summary line with a warehouse result.
If the business needs an early signal, publish it as provisional and compare cohorts at the same age. For example, compare day-3 activation at day 3, then day-14 repeated value when that window matures. A leading indicator can be useful without pretending it is final retention.
Preserve the denominator when combining cohorts
Suppose one mature cohort has 10 users and 8 retained, while another has 90 users and 27 retained. Their rates are 80% and 30%.
The pooled user-level retention rate is (8 + 27) / (10 + 90) = 35%. A simple average of the two percentages is 55%. That simple average gives the ten-user cohort the same influence as the ninety-user cohort. It answers a different question about the average cohort rate rather than the proportion of all users retained.
When combining cohorts, show the numerator, denominator and weighting rule. If a vendor's summary does not match your pooled rate, inspect its interval eligibility and aggregation method before assuming an error. Do not reconstruct an overall number from rounded percentages if the underlying counts are available.
Keep the denominator fixed to the entry cohort for ordinary cohort retention. Dividing week-2 active users by week-1 active users produces a different ratio. It is not automatically the fraction of week-1 users who survived into week 2 unless you also take the intersection of those user sets.
In the ten-user fixture, week-1 retained users are A, B and C; week-2 retained users are A and D. Dividing 2 by 3 gives 66.7%, but only A appears in both sets. The transition retention among week-1 users is 1/3, or 33.3%. This is a useful test for a misleading “previous period” chart interpretation.
Freeze segmentation at the right moment
If the question is whether customers acquired on the starter plan retain, use the plan at cohort entry. Filtering by the current plan can move successful upgraders out of the starter segment and make historical starter retention look worse.
The same issue affects account size, acquisition channel and customer-success tier. Store relevant entry attributes or use an event-time historical model. For a different question, such as which currently enterprise accounts were retained, current attributes may be appropriate. Name the distinction.
Changes in audience mix can also move the overall curve without changing retention within either segment. Imagine assisted-onboarding customers retain at 80% and self-serve customers at 30%. If the first cohort is 80% assisted and 20% self-serve, its expected aggregate is 70%. If the next cohort is 40% assisted and 60% self-serve, the aggregate is 50%, even though both segment rates are unchanged.
Investigate that mix before declaring a product regression. Conversely, an improving aggregate can conceal deteriorating segment performance if the acquisition mix shifts toward an easier-to-retain audience.
These comparisons identify hypotheses; they do not establish that onboarding assistance caused retention. Customers receiving assistance may differ in budget, intent or complexity. Use a suitable experiment or carefully designed evaluation when the decision requires a causal claim.
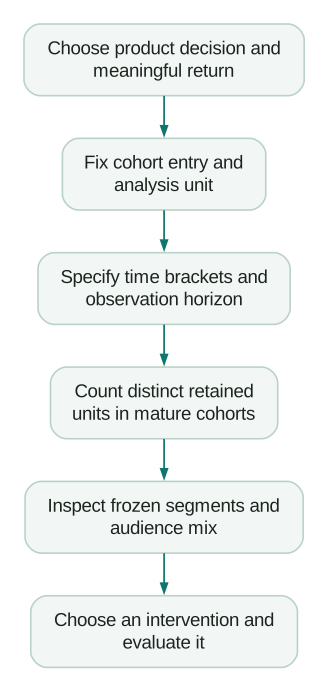
Turn the chart into a useful next action
A sharp early drop suggests examining the path from first value to the next useful outcome. A recurring weekly pattern may indicate a healthy work cadence, not daily disengagement. A decline in account-level activity alongside stable user-level activity can mean a small set of power users is masking broad account loss.
Inspect a manageable sample of retained and non-retained units from the same mature cohort. Trace successful tasks, errors, time-to-value and support context. Avoid choosing only dramatic replay sessions. Define the sample and record which evidence is missing.
Use key customer journey analysis to locate a plausible friction point, then decide whether the response belongs in product, onboarding or CRM lifecycle operations. Sending more email is not the default answer to a broken workflow.
If building a churn model later, ensure features are available before the prediction date. Retention labels constructed using future activity must not leak into the input features. Our guide to predicting and preventing churn with AI covers the operational distinction between a useful prediction and an intervention that helps.
Validate the definition before sharing the curve
- The report names the unit, entry event, return event and first-ever or recurring rule.
- Historical coverage supports any claim that a unit is new.
- Timezone, bucket boundaries and observation cutoff are explicit.
- Immature periods are excluded or clearly marked provisional.
- Multiple events from one unit count once within each return bracket.
- Entry attributes remain stable when current customer properties change.
- Aggregate rates reconcile to their underlying counts and weighting rule.
- The ten-user boundary fixture produces the expected distinct return sets.
Keep the definition short enough to sit beside the chart. A reader should be able to tell what improved, for whom and over what observation period without asking the analyst to reverse-engineer the query.
Questions people ask
What is the best starting event for a retention cohort?
Choose the event that matches the decision. Signup is useful for the full acquisition journey, while first successful value is useful for repeated-value analysis; report both when activation loss matters.
Is on-or-after retention better than exact-period retention?
Neither is universally better. On-or-after asks whether a unit eventually returned within the observation horizon, while exact-period retention measures return in a particular interval or cadence.
Can retention increase in a later week?
Yes, for exact-period retention a unit can return in week 3 after being absent in week 2. That differs from a consecutive-return measure, so a rising cell is not automatically a data error.
Should B2B products measure users or accounts?
Use accounts or workspaces for questions about retained customer organizations and users for questions about individual adoption. A useful B2B view often needs both, with consistent membership and identity rules.
Does a cohort comparison prove a product change improved retention?
No. Cohorts can differ in acquisition mix, seasonality, maturity and customer characteristics. Use the comparison to identify a hypothesis, then evaluate the intervention with a design appropriate to the causal claim.
Sources
- PostHog: Retention definitions and calculation options. Accessed 22 September 2026.
- Amplitude: Interpret retention analysis. Accessed 22 September 2026.
- Amplitude: How time works in retention analysis. Accessed 22 September 2026.
- Mixpanel: Retention report and criteria. Accessed 22 September 2026.
Written by
Jafrin Akter AloData Engineer and Co-founder, martechdevs
Jafrin Akter Alo is a data engineer and co-founder of martechdevs, where the team has delivered 74+ martech, data and growth stack implementations.