
CAC Payback Period: Build a Calculation You Can Trust
Data Engineer and Co-founder, martechdevs
Last updated 9 min read
CAC payback period measures how long a customer cohort takes to generate enough gross profit to recover its acquisition cost. Use acquisition costs and revenue from a consistent cohort, include the relevant cost of serving those customers and distinguish observed recovery from a forecast. A simple CAC-to-monthly-margin ratio is useful, but it can conceal sales-cycle lag, churn, expansion and cash timing.
Last updated: 24 September 2026.
Decide which payback question you are answering
A founder may need to know how long cash remains tied up in growth. A marketing manager may need to compare acquisition segments. Finance may need a repeatable cohort profitability view. These questions overlap, but one number does not fully answer all three.
For a steady monthly revenue assumption, the familiar shortcut is:
CAC payback in months = CAC per new customer ÷ monthly gross profit per customer.
Monthly gross profit per customer can be estimated as monthly average revenue per account multiplied by gross margin. ChartMogul's payback definition presents this formula and distinguishes fully loaded acquisition cost from media-only cost.
For an observed cohort, a more direct calculation is the first month when cumulative gross profit from that cohort reaches its allocated acquisition cost. That approach can incorporate the actual changes in revenue and serving cost as the cohort matures.
Neither calculation is company-wide profitability. Research, administration and other operating costs still exist. A customer cohort reaching gross-profit payback does not mean every subsequent dollar is net profit.
A marketing data warehouse can connect acquisition costs, customer identity and billing history, but it cannot choose the cost allocation policy for you. Agree on that policy before automating the report.
Build the acquisition-cost numerator honestly
Start with a documented new-customer acquisition cost pool. It may include paid media, relevant sales and marketing compensation, commissions, agency work, events and acquisition tooling. Separate work focused on existing-customer expansion or retention when the report is specifically about new-customer acquisition.
Shared expenses need a defensible allocation rather than a hidden omission. If a sales team spends part of its time on renewals, document how its cost is allocated. If the data only supports a broad blended pool, publish that limitation instead of inventing precise customer-level costs.
Consider a hypothetical cohort assigned $30,000 in acquisition expense: $12,000 media, $14,000 relevant people costs and $4,000 tools and external work. With 20 new paying customers, allocated CAC is $1,500 per customer. Media-only CAC would be $600. Those are different cost scopes, not two competing calculations of the same thing.
Do not count the same commission both in acquisition cost and in the serving-cost denominator. Likewise, do not remove a real cost merely because its accounting treatment spreads recognition over time. This management metric needs a written cost basis; align it with finance and keep its reconciliation to financial reporting available.
Early-stage businesses can also model future efficiency separately. An underutilized team may acquire more customers without proportional headcount growth. That is a planning scenario, not a reason to quietly erase current salaries from observed CAC.
Match acquisition spending to the customer cohort
Dividing October marketing expense by October wins is convenient. It can be misleading when those customers entered the sales process months earlier or when October spending is building next quarter's pipeline.
Use one of three clearly named approaches according to the evidence available. A contemporaneous blended ratio pairs period expense with period wins and is useful as an operational trend when the system is relatively stable. A lagged ratio applies a documented acquisition-cycle lag. A cohort allocation assigns an approved share of relevant acquisition expense to the customers or opportunities it helped acquire.
None is automatically exact. A fixed one-month lag can still misrepresent a business whose self-serve and enterprise sales cycles differ substantially. Show segment-level cycle distributions and test whether the conclusion changes under reasonable allocation choices.
Keep unsuccessful acquisition effort in the cost pool. Allocating only the sales calls and ads attached to won deals omits the expense of losing deals, producing an artificially efficient CAC. Your attribution model is evidence about touchpoints, not a complete cost accounting system.
Use marketing attribution models for the question they answer, then reconcile allocated channel costs back to the total acquisition pool. Unattributed customers and shared brand spend should remain visible rather than disappearing from the report.
Calculate the shortcut with consistent units
Suppose the $1,500-CAC cohort starts at $250 monthly revenue per customer and a 75% gross margin. Monthly gross profit is $187.50, so shortcut payback is $1,500 ÷ $187.50 = 8 months.
Using revenue alone would give 6 months. Using media-only CAC with the same gross-profit denominator gives 3.2 months. A dashboard can therefore show 3.2, 6 or 8 months from the same business simply by changing its definitions.
Make the units visible. Annual revenue per customer must be converted to a monthly basis if the output is months. A margin of 75% is 0.75 in the calculation, not 75. A zero or negative gross-profit denominator does not produce a useful positive payback estimate.
For mixed products, avoid multiplying an arbitrary overall margin by one segment's revenue. A compute-intensive customer group may cost more to serve than a lightweight group. Bessemer's operational guidance on profitable growth discusses hosting, implementation and support as distinct cost levers. Build the segment's serving-cost assumptions from its actual workload where material.
Follow actual cohort gross profit over time
For the same $30,000 acquisition cohort, suppose observed monthly gross profit is $3,000, $3,300, $3,600, $3,900, $4,200, $4,500, $4,800 and $5,100. These hypothetical amounts include revenue and serving costs from the original 20 customers only, including any churn or expansion within that cohort.
Cumulative gross profit reaches $27,300 after month 7 and $32,400 after month 8. The cohort first pays back by the end of month 8. Linear interpolation within month 8 would estimate 7 + ($30,000 − $27,300) ÷ $5,100, or about 7.53 months. That fractional estimate assumes gross profit accrues evenly during the month; do not present it as an observed exact date.
This original Python helper calculates the first completed monthly bucket where cumulative gross profit reaches acquisition cost. Values are integer cents, and negative adjustments are allowed:
def first_payback_month(acquisition_cost_cents, monthly_gross_profit_cents):
    if type(acquisition_cost_cents) is not int or acquisition_cost_cents <= 0:
        raise ValueError("Acquisition cost must be positive integer cents")
    cumulative = 0
    for month, gross_profit in enumerate(monthly_gross_profit_cents, start=1):
        if type(gross_profit) is not int:
            raise ValueError("Gross profit must use integer cents")
        cumulative += gross_profit
        if cumulative >= acquisition_cost_cents:
            return month
    return None


monthly_gp = [300000, 330000, 360000, 390000,
              420000, 450000, 480000, 510000]
print(first_payback_month(3000000, monthly_gp))
The result is 8. With only the first seven months supplied, the result is None, meaning recovery has not been observed in the supplied window. It does not mean zero payback, and it does not prove the cohort will never recover.
The helper reports first crossing only. Later credits or negative gross profit can pull the cumulative balance below cost again. Keep the full cumulative series and distinguish first crossing from sustained recovery if reversals are material to the business.
Keep churned customers and immature cohorts visible
Do not calculate payback only among customers that survived long enough to pay back. That selects successful customers and excludes exactly the losses the metric should reveal.
Retain the full acquisition cohort. Churned customers contribute their actual revenue and costs, then whatever later adjustments apply. Expansion from remaining customers can help the cohort recover, but it should not hide a large share of customers that never individually recovered their allocated cost.
For customer-level distributions, report the proportion paid back by a fixed age, the observation horizon and the unrecovered share. A median computed only among paid-back customers is not the median for the acquired population. If fewer than half have paid back by the cutoff, say that the population median has not yet been observed.
Read payback alongside net revenue retention and cohort retention. A projected twelve-month payback is less reassuring if a large fraction of the cohort leaves before month six. Conversely, actual expansion can make a flat-revenue shortcut too pessimistic.
Keep forecasts separate from observed values. A chart can show a solid observed cumulative line and a clearly identified forecast scenario, with its retention, expansion and margin assumptions. Do not fill future months with the current average and label them actual.
Separate economic recovery from cash recovery
An annual prepayment can improve liquidity before the service has been delivered. It does not mean the entire payment is gross profit available without future obligations.
Stripe's subscription revenue-recognition methodology explains how service periods affect recognition. David Skok's SaaS metric definitions also distinguish bookings, billings and revenue. Use those distinctions when someone proposes dividing acquisition expense by cash collected this month.
Maintain a separate cash recovery view if liquidity is the decision. Include collection timing, refunds and cash servicing obligations under an explicit convention. For the economic cohort view, use the agreed revenue and serving-cost basis over the service period.
Also name where the clock starts. A payback measure beginning at customer acquisition excludes the months spent funding acquisition before the contract closes. For runway planning, map actual spending and collections on a calendar timeline rather than simply adding an average sales cycle to a post-acquisition payback ratio.
Stress-test the levers before changing the budget
Return to $1,500 CAC, $250 monthly revenue and $62.50 monthly serving cost. Gross profit is $187.50 and shortcut payback is 8 months.
Now offer a 20% price discount while serving cost remains $62.50. Revenue falls to $200, gross profit to $137.50 and payback rises to about 10.91 months. Keeping the old 75% margin would underestimate the deterioration because the cost did not fall with price.
Alternatively, reduce serving cost from $62.50 to $50 while holding price and CAC constant. Gross profit becomes $200 and payback becomes 7.5 months. Reducing CAC to $1,200 while preserving the original $187.50 gross profit gives 6.4 months.
These scenarios show three different mechanisms: pricing, delivery efficiency and acquisition efficiency. They are not interchangeable, and none is guaranteed to preserve retention or conversion. A price change can alter win rate; cutting support can increase churn; reducing media spend can change the mix of customers acquired.
For a proposed channel expansion, evaluate the incremental cohort you expect at the higher spend level. Historic blended CAC can look excellent because of referrals or a small efficient audience while the next marginal customers are expensive. Run a bounded investment test and compare mature cohorts rather than extrapolating the average indefinitely.
Our marketing ROI guide explains why the commercial decision needs more than attributed revenue. Payback adds the timing of recovery, but it still depends on a defensible cost and customer model.
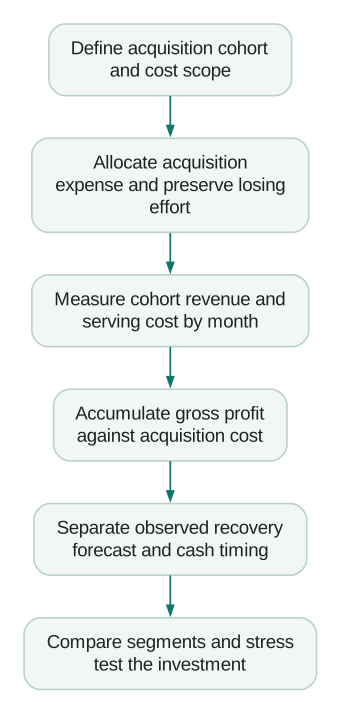
Review the calculation before using it to scale
- Acquisition costs reconcile to the approved expense pool, including unsuccessful effort.
- New-customer costs are distinguished from expansion and retention spending.
- The cohort and acquisition-cycle allocation method are documented.
- Revenue and serving cost use consistent monthly units and customer identities.
- Churned customers remain in the cohort and immature customers are not declared failures or successes prematurely.
- The cumulative series reconciles to billing and cost records, including later adjustments.
- Observed, forecast and cash-based payback are labelled separately.
- The budget decision considers retention, margin sensitivity and incremental acquisition cost.
The practical output is a cohort ledger and a decision range, not a flattering universal target. Use the report to identify the limiting mechanism, assign an owner and measure whether the proposed change improves recovery without weakening the product or customer base.
Questions people ask
What is the basic CAC payback formula?
Divide acquisition cost per new customer by monthly gross profit per customer. The common shortcut estimates monthly gross profit as monthly revenue per account multiplied by gross margin, with clearly stated stability assumptions.
Why should gross margin be included?
Revenue used to deliver the service is not available to recover acquisition expense. Use the relevant serving costs or a defensible gross-margin assumption, and avoid counting the same expense twice.
Does annual upfront payment mean immediate payback?
It may improve cash recovery, but the business still owes future service and incurs delivery costs. Keep cash collection and economic gross-profit recovery as separate, explicitly defined views.
What if the cohort has not paid back yet?
Report that recovery has not been observed by the current cohort age. A forecast can estimate a later crossing, but it must remain separate from actual results and include its retention and margin assumptions.
Is a shorter payback period always the better strategy?
No. Compare scale, customer quality, retention, margin and the cost of acquiring the next customers. A very short historical payback can coexist with a small saturated channel, while a longer one may or may not be supportable given the business's capital and customer economics.
Sources
- ChartMogul: CAC payback period. Accessed 24 September 2026.
- Bessemer Venture Partners: A CEO's tactical guide to profitable growth. Accessed 24 September 2026.
- Stripe: Subscription and invoicing revenue-recognition methodology. Accessed 24 September 2026.
- David Skok: SaaS Metrics 2.0 detailed definitions. Accessed 24 September 2026.
Written by
Jafrin Akter AloData Engineer and Co-founder, martechdevs
Jafrin Akter Alo is a data engineer and co-founder of martechdevs, where the team has delivered 74+ martech, data and growth stack implementations.