
Data Quality Metrics for Marketing: Formulas and a Monthly Scorecard
Data quality metrics measure whether the information behind a report or customer action meets its operating requirements. Track usable delivery, required fields, valid business keys, accepted values and reconciliation against an independent source. Then measure how quickly monitoring finds and resolves failures. Give each number a defined population, calculation, owner and response so the scorecard tells the team what to improve.
On this page

Which outputs should your data quality scorecard protect?
Start with the reports, audiences and syncs that people use to make consequential decisions. A small, owned set is more useful than a percentage covering every table in the warehouse.
Choose an output such as paid-media cost by qualified account, the renewal audience or the invoice reconciliation used at close. Record its business key, required sources, reporting period, currency, exclusions and consumer. Those choices establish what the quality metrics must measure. The marketing data quality guide explains the monitoring and response system around these checks.
| Output | Required population | Decision it protects | Evidence of readiness |
|---|---|---|---|
| Acquisition report | Registered ad accounts and the eligible lead cohort | Where the growth team spends next | Complete source slices, agreed joins and usable cutoff |
| Renewal audience | Accounts eligible under the current renewal policy | Who may receive a reminder | Correct membership, current exclusions and destination acceptance |
| Paid-invoice report | Eligible invoices under one status and period rule | Which revenue figures finance can use | Matching invoice IDs, amounts and currencies |
Measure the final consumer as well as the model. A warehouse result can be correct while a cached dashboard remains stale or a customer relationship management (CRM) sync rejects the update. Our warehouse implementation work connects these checks to the output and its operating owner.
How do data quality dimensions differ from metrics?
A dimension describes a quality concern; a metric specifies how you measure it for a particular population. Completeness might mean required fields exist on delivered rows, or that every expected record arrived. Those measurements need different denominators.
There is no single universal six-item checklist behind every quality system. ISO/IEC 25012 defines fifteen characteristics across inherent and system-dependent viewpoints and recognizes that their priority varies by stakeholder. Use that framework to identify requirements, then write an executable measure for the actual output. ISO data quality model.
For every metric, retain its name, version, numerator, denominator, eligibility rule, observation window, source and failure response. The metric contract guide covers how to keep that definition consistent across dashboards and assistants.
Which dataset metrics should you calculate first?
Calculate delivery readiness, field completeness, record coverage, excess duplicates, validity and reconciliation separately. They answer different questions and should retain separate failure reasons.
The following formulas are implementation definitions to adapt. Percentages multiply the stated ratio by 100. A zero denominator returns an unavailable or not-applicable result with its reason; it does not automatically become a passing percentage.
| Metric | Numerator | Denominator | Interpretation |
|---|---|---|---|
| Ready-delivery rate | Deliveries meeting cutoff, coverage and quality requirements by deadline | All scheduled eligible deadlines | Whether the consumer had usable data when needed |
| Required-field completeness | Delivered rows containing every required field under the missing-value policy | Delivered rows in that audit scope | Whether received records contain the necessary information |
| Expected-record coverage | Distinct expected business keys present in the delivered data | Distinct keys in the complete expected manifest | How much of the expected population arrived |
| Excess duplicate rate | Keyed delivered rows minus distinct delivered business keys | Delivered rows with usable business keys | How many extra copies exist beyond one per key |
| Validity rate | Evaluated records satisfying the named value or relationship rule | Records eligible for that rule | Whether values conform to a stated requirement |
| Reconciliation exceptions | Missing, unexpected, duplicated or mismatched business records | The stated reference population where a rate is meaningful | Which records prevent agreement with the reference |
Google SRE recommends expressing service-level indicators as good events divided by total events and distinguishes pipeline freshness, correctness and coverage. The measures above apply that approach to marketing outputs with their own counting rules. Google SRE: implementing SLOs.
Ready delivery includes the runs that never happened
Build the denominator from the expected schedule. If a daily report has 30 deadlines and its job runs only 29 times, the missing run still belongs in the reliability calculation. A successful run that omits a required ad account also fails a readiness contract that requires all accounts.
Keep source-through time, model publication and destination availability separate. Updating a job timestamp cannot make old source data current. Use the deadline-based freshness agreement to define which boundary the consumer relies on.
Field completeness and record coverage need separate rows
An extract can have every field populated on 900 delivered records while 100 expected records are absent. Field completeness can be 100%; expected-record coverage is 90% if the independent manifest contains 1,000 eligible records.
Define missing values per field. Empty strings, whitespace and placeholders may be unusable even when they are not database nulls. Zero can be a legitimate amount, so do not classify it as missing automatically. For source attribution, preserve genuinely unknown acquisition as unknown; inserting “Direct” merely fills a field without establishing its meaning.
Duplicate metrics depend on the grain and counting convention
For keys A, A, A, B, there are two excess copies among four keyed rows: 50%. Three rows belong to a duplicated group: 75%. One of the two distinct keys is duplicated: 50%. These are different measures, and the first and third happen to agree in this example.
Name the convention in the scorecard. Test the actual composite key, such as store plus order ID or account plus invoice ID. Missing or malformed keys need their own count; excluding them from a duplicate calculation must not make them disappear from the quality review.
Reconciliation needs the same business entity on both sides
Compare paid invoices with the equivalent paid-invoice population. Orders, invoices, payments and CRM deals can have different relationships, so subtracting their totals is not a defensible completeness test. Align status, cutoff, adjustments and currency before calculating the gap. The Stripe and CRM reconciliation guide explains those boundaries.
Keep missing and unexpected records separate. Suppose the reference has 4,075 eligible invoice IDs and the warehouse has 4,010 distinct IDs. The net count difference is 65, or 1.60% of the reference. If 10 warehouse IDs are unexpected, only 4,000 expected IDs matched: 75 are missing, and coverage is 98.16%. Reporting only the net gap hides the two directions of error.
For monetary reconciliation, retain both the signed total difference and the absolute record-level differences, by currency. Overstatements and understatements can cancel in a total. Even equal amounts and counts need the key-level checks shown in the quality reconciliation example.
How can you test the denominators on a small fixture?
Use a deliberately imperfect delivery whose correct result can be worked out by hand. This Python 3 example counts expected-record coverage and excess duplicates independently. It operates on one already-scoped business-key population; it does not compare amounts or establish source completeness for you.
The expected manifest must be independently confirmed complete. IDs are opaque strings with no surrounding whitespace. The helper retains a count of unusable delivered keys and rejects an invalid or duplicated expected manifest.
from collections import Counter


def delivery_metrics(expected_ids, delivered_ids, *, manifest_complete):
    if manifest_complete is not True:
        raise ValueError("Confirm the expected manifest before measuring coverage")
    if not isinstance(expected_ids, (list, tuple)) or not isinstance(
        delivered_ids, (list, tuple)
    ):
        raise TypeError("Supply sequences of business keys")

    def usable(key):
        return isinstance(key, str) and bool(key) and key == key.strip()

    if any(not usable(key) for key in expected_ids):
        raise ValueError("Expected keys must be usable")
    if len(expected_ids) != len(set(expected_ids)):
        raise ValueError("Expected keys must be unique")

    expected = set(expected_ids)
    keyed = [key for key in delivered_ids if usable(key)]
    counts = Counter(keyed)
    received = set(counts)
    matched = len(expected & received)
    excess = len(keyed) - len(received)

    def percent(numerator, denominator):
        return 100 * numerator / denominator if denominator else None

    return {
        "expected_records": len(expected),
        "delivered_rows": len(delivered_ids),
        "unusable_key_rows": len(delivered_ids) - len(keyed),
        "matched_expected_records": matched,
        "missing_expected_records": len(expected - received),
        "unexpected_distinct_records": len(received - expected),
        "excess_duplicate_rows": excess,
        "expected_record_coverage_pct": percent(matched, len(expected)),
        "excess_duplicate_pct_of_keyed_rows": percent(excess, len(keyed)),
    }


result = delivery_metrics(
    ["A", "B", "C", "D", "E"],
    ["A", "B", "B", "D", "X", None],
    manifest_complete=True,
)
assert result["expected_record_coverage_pct"] == 60.0
assert result["excess_duplicate_pct_of_keyed_rows"] == 20.0
assert result["unusable_key_rows"] == 1
The six deliveries contain five usable keys and four distinct usable IDs. Three expected records arrived; C and E are missing, X is unexpected and B has one excess copy. Counting delivered rows would conceal the loss.
Test an exact match, an empty confirmed batch, a missing source manifest, reused IDs across source accounts and a duplicated expected key before adopting the calculation. An empty confirmed expected population has no coverage percentage; unexpected deliveries can still be an exception. Preserve the counts alongside every ratio.
Which metrics show whether monitoring is working?
Measure discovery, recovery, recurrence and operating coverage against recorded incidents and critical outputs. These measures evaluate the monitoring process; they do not replace the dataset checks.
Use one incident ID for a shared failure and retain its affected outputs separately. Ten alerts from one broken source should not become ten unrelated incidents. The data incident runbook supplies the response record these metrics depend on.
| Program measure | Calculation or observation | Record beside it | Decision it supports |
|---|---|---|---|
| Detection delay | First detection time minus established impact-start time | Unknown start times and their count | Which checks discover failures too late |
| Recovery time | Consumer-restored time minus first detection time | Open incidents and their current age | Where recovery or final delivery remains slow |
| Monitoring-first discovery | Known incidents first found by monitoring / known incidents with recorded discovery route | Total incidents and unknown discovery routes | Which failures still reach stakeholders before alerts |
| Repeat incidents | Incidents recurring under a defined mechanism classification | Classification version and incident IDs | Which repairs failed to remove the cause |
| Overdue warnings | Open warnings past their agreed action date | Severity, owner and business consequence | Where responsibility or capacity is missing |
| Critical-output coverage | Registered critical outputs with an owner and demonstrated relevant checks / registered critical outputs | Missing schedules, failed alert drills and exclusions | Where essential decisions remain unprotected |
Define the time clocks before comparing teams. If the impact-start time is unknown, report that rather than replacing it with the alert time and producing zero detection delay. Resolution means the required consumer can use the output again; an acknowledged ticket or repaired source job may occur earlier.
Show the median, range and underlying incident count. With four observations, an elaborate percentile can imply more stability than the evidence supports. Include open incidents separately so a long-running failure does not disappear merely because only closed tickets enter the recovery calculation.
Monitoring-first discovery describes known incidents. It cannot tell you how many failures remain undiscovered. Track controlled failure drills and scheduled-monitor execution alongside it, and keep drill results separate from real incident counts.
How should you choose targets and failure responses?
Set targets with the person who owns the affected decision, using the consequence of an error and the team's ability to respond. Baseline behavior helps estimate the work required; it does not make an unacceptable defect acceptable.
A renewal audience may need every required suppression check to pass before sending. A provisional campaign report may tolerate a declared source delay while automated budget changes remain paused. Record those responses with the metric instead of copying one percentage across both outputs.
Use absolute counts and exposure as well as percentages. One missing large account can matter more than several small ones. Keep record coverage and affected monetary value separate, with currency and reference period stated. Use the cost-of-bad-data method when deciding which repeated defect deserves investment.
Avoid averaging unrelated checks into permission to publish. A high overall score cannot compensate for a failed required key, permission or financial-reconciliation check. Define the blocking conditions explicitly and report the remaining measures as diagnostics.
What does a useful monthly scorecard look like?
A monthly scorecard pairs each metric with its population, result and next action. The following fictional 15-person SaaS company reviews three outputs and its monitoring program. Each row names its own denominator; these rows are not one interchangeable dataset.
| Measure and scope | Calculation | Result | Interpretation and action |
|---|---|---|---|
| Acquisition report ready by deadline | 28 good deliveries / 30 eligible deadlines | 93.33% | Below its agreed 29-of-30 target; inspect the two failed deadlines |
| Required value and currency on audited purchase records | 4,950 complete / 5,000 delivered | 99.00% | Investigate the 50 incomplete records and their source paths |
| Paid-invoice record coverage | 4,000 matched expected IDs / 4,075 expected IDs | 98.16% | Repair 75 missing IDs; also review 10 unexpected IDs separately |
| Monitoring-first discovery | 3 monitoring-first incidents / 4 incidents with known route | 75.00% | Add the check exposed by the stakeholder-discovered incident |
| Detection delay for four known-start incidents | Median of 2, 4, 6 and 30 hours | 5 hours | Investigate the 30-hour detection gap as well as the median |
The ready-delivery target is 29 ÷ 30, or 96.67%. The measured result misses it by 3.33 percentage points and one required good delivery. That target belongs to this hypothetical contract.
The invoice row uses the matched expected population, so the 10 unexpected IDs cannot improve coverage. The purchase-field row measures completeness among delivered records; its 99% does not establish that every expected purchase arrived. Keep that distinction when presenting the same scorecard to finance and growth.
For each unresolved row, add an owner, due date and evidence link in the operational version. Preserve the previous month's definition and scope. If the required-field list or source inventory changes, show the change before interpreting movement as improved reliability. Use the CRM hygiene review for the source-property and ownership work behind recurring CRM exceptions.
Where should you store the measurements and history?
Store an append-only per-run measurement record with the output, metric version, scope, numerator, denominator, result, target and evaluation state. Keep failed, skipped, errored and missing runs distinguishable. A test that did not evaluate should not contribute a passing observation.
The stored record should identify the source cutoff, run ID and evaluated population or query version. Keep restricted record-level exception evidence separate from the summary shared with business users.
| Existing tool | Useful capability | Interpretation to preserve |
|---|---|---|
| dbt | Store the rows that fail a data test | store_failures replaces previous failures for the same test, including after a passing run; retain per-run metrics elsewhere |
| Elementary | Explore test results, anomalies, artifacts and runs from its dbt package tables | The report needs its package, connection profile and CLI; confirm the available history |
| Snowflake | Measure attributes with system data metric functions | Managed quality monitoring requires Enterprise Edition; distinguish measured values from their expectations |
| Knowledge Catalog on BigQuery | Apply quality rules and export scan results to BigQuery | Scores represent the percentage of rules passed; row-level and aggregate rules have different result semantics |
Those capabilities are documented in dbt's stored-failure reference, Elementary's report guide, Snowflake's system DMFs and Google Cloud's quality-scan overview.
Google Cloud's scan configuration can filter rows, use an incremental scope or sample data. Save that configuration with the result so a score from a selected subset is not presented as whole-table coverage. Its overall rule-pass score and your business-record coverage rate can both be useful while measuring different things. Quality-scan scope and results.
Use the dbt testing examples to implement assertions and the data observability tool comparison when the missing capability is result history, alert delivery or investigation. Start with the tooling you already operate when it can produce the required evidence.
How should the monthly review change the work queue?
Use the review to identify the next concrete reliability improvement and confirm who will deliver it. Check denominator changes and missing observations before reacting to a trend, then prioritize the failed decision or escaped incident with the greatest consequence.
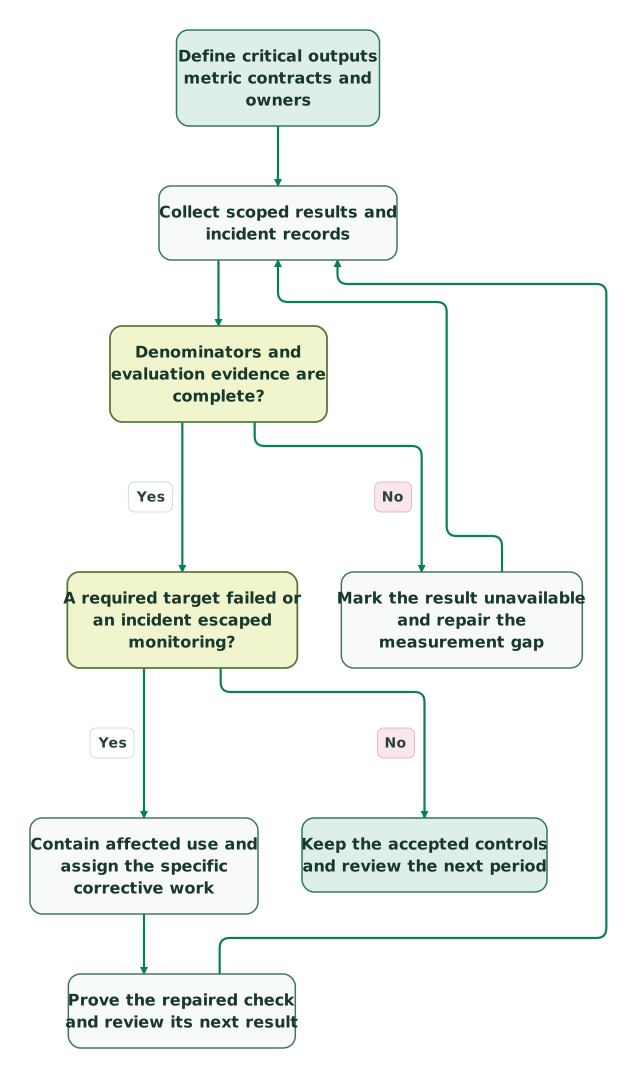
Read diagram as text
- Define critical outputs metric contracts and owners to Collect scoped results and incident records.
- Collect scoped results and incident records to Denominators and evaluation evidence are complete?.
- Denominators and evaluation evidence are complete? to Mark the result unavailable and repair the measurement gap: No.
- Mark the result unavailable and repair the measurement gap to Collect scoped results and incident records.
- Denominators and evaluation evidence are complete? to A required target failed or an incident escaped monitoring?: Yes.
- A required target failed or an incident escaped monitoring? to Contain affected use and assign the specific corrective work: Yes.
- Contain affected use and assign the specific corrective work to Prove the repaired check and review its next result.
- A required target failed or an incident escaped monitoring? to Keep the accepted controls and review the next period: No.
- Prove the repaired check and review its next result to Collect scoped results and incident records
The monthly meeting does not replace an immediate incident response. Customer-action failures still follow their operating runbook when detected. The scorecard shows whether those controls are improving over time.
Before adopting the scorecard:
Checklist
- List the critical outputs, decision owners and expected schedules.
- State every numerator, denominator, window and missing-value rule.
- Keep field completeness, record coverage and duplicate conventions distinct.
- Match entity, cutoff and currency before reconciliation.
- Preserve skipped checks, missing runs and unavailable denominators.
- Record discovery route and detection, acknowledgement and restoration clocks separately.
- Test a missing record, repeated key, empty confirmed batch and invalid manifest.
- Agree targets and blocking conditions with the consumer.
- Retain historical metric versions and one owned action for each unresolved result.
Want a second pair of eyes on your stack? Get the $99 martech audit with one report or audience and its current quality measures. For a defined implementation, request a detailed warehouse scope covering the metric contracts, result history and failure tests.
Keep reading
Browse all Data Warehouse guides
 Data Warehouse
Schema Drift in Marketing Pipelines: 7 Changes to Detect
Detect seven forms of schema drift in marketing pipelines. Compare contracts and alerts, catch new CRM values and repair reports without losing records.
Jafrin Akter AloLast updated 12 min read
 Data Warehouse
Data Observability Tools Compared: dbt Tests, Elementary, Soda, Great Expectations, Monte Carlo, Metaplane and Sifflet
Compare dbt tests, Elementary, Soda, Great Expectations, Monte Carlo, Metaplane and Sifflet on setup, pricing units, alerts and fit for small data teams.
Jafrin Akter AloLast updated 16 min read
 Data Warehouse
Data Incident Runbook: 8 Steps to Recover Marketing and Product Data
Resolve marketing data incidents with eight practical steps, severity rules, replay limits, reconciliation checks and copyable stakeholder messages.
Jafrin Akter AloLast updated 14 min read
Data warehouse & CDP
See the implementation scope, deliverables and acceptance checks.
Questions people ask
How should an incident affecting several reports enter the scorecard?
Count the shared failure once in the incident register and keep a separate list of affected outputs. Each output can still miss its own delivery deadline, so incident count and failed-delivery count will differ. Preserve the common incident ID in both records. This allows the team to measure customer impact without inflating the number of root causes or hiding a failed consumer behind another consumer's recovery.
What should monitoring-first discovery show in a month with no incidents?
Show zero known incidents and mark the discovery percentage not applicable. There is no incident denominator from which to calculate 100% detection. Report whether scheduled checks ran, whether controlled failure drills reached the intended responder and whether critical outputs remained within their contracts. Keep those observations separate from the discovery rate so a quiet month remains interpretable.
Should a repaired historical batch overwrite its original quality result?
Keep the original evaluation and add the repair run as a new observation linked to it. The repair establishes the current state; the original result explains what a consumer could rely on at the earlier deadline. Record which records or periods changed and why. A late successful rebuild can close an incident while the original missed delivery remains part of the reliability history.
How can a sampled quality check support a monthly report?
Label the sampling method, evaluated population and sample size beside the result. A sampled validity rate can help investigate a broad population, but it does not prove that every required key or recipient was checked. Use complete checks where the consumer requires exact coverage, such as an expected-invoice manifest or a suppression gate, and keep uncertainty visible when estimating a wider defect rate.
Why can a vendor's quality score disagree with our scorecard?
Compare the underlying units and rules before treating the difference as an error. A vendor may report the proportion of rules passing while your scorecard measures records arriving, fields populated or deadlines met. Null handling, sampling and filters can also change the evaluated population. Retain the vendor result with its definition, then calculate the business metric from the evidence it actually supports.
Sources

Written by
Jafrin Akter AloData Engineer and Co-founder at Martechdevs and Growth and Analytics Partners
Jafrin writes practical guides to marketing technology, customer data, analytics and AI workflows. Martechdevs is a Growth and Analytics Partners company.