
A/A Testing: Experiment Validation, False Positives and a Worked Example
An A/A test assigns eligible users to groups that receive the same experience, then checks assignment, exposure logging and measurement. Use A/A testing when introducing or changing an experimentation system, rather than treating it as a routine certificate of correctness. A nonsignificant result does not prove the setup is fair, and a significant result does not by itself identify a fault.
On this page
A/A testing checks and boundaries
An A/A test provides evidence about a specified workflow and population, with separate operational and statistical checks.
| Check | Useful evidence | Boundary |
|---|---|---|
| Assignment | Stable group for the intended randomization unit | Equal-looking totals do not establish independence |
| Exposure | Logged evaluation at the intended point | Assignment alone does not show the experience was reached |
| Measurement | Known outcomes reconcile with the metric pipeline | Both groups can share the same measurement error |
| Statistical analysis | Results interpreted under the chosen method and stopping rule | One p-value cannot certify the platform |
| Operational recovery | Correct output after an identified repair | A repaired component needs repeated validation |
Statsig's A/A setup guide distinguishes live instrumentation checks from simulated A/A analysis. Microsoft's experimentation research describes repeated simulated splits as a way to inspect metric behavior. The two exercises answer related but different questions.
We would begin with the change being qualified. A new SDK needs different evidence from a new revenue metric or a new statistical method. Name that change and retain the input and expected result for each operational check before collecting more traffic.
At Martechdevs, we connect assignment, product events and business outcomes through our product analytics implementation service. The useful result is a bounded release decision with evidence and a repair owner, rather than a green label based only on significance.

A/A tests and A/B tests
An A/B test compares deliberately different experiences. An A/A test keeps the intended experience the same while exercising the assignment and analysis process. It can reveal missing exposure events, inconsistent identifiers or a metric pipeline that behaves unexpectedly.
Identical page content does not guarantee identical measurement. One code path might log exposure earlier, a cache might preserve the wrong assignment, or a returning user might receive a new identity. Those implementation differences can create an apparent effect despite the intended A/A design.
The reverse limitation also matters. Both groups can omit mobile purchases or use the same incorrect revenue join. Their results may agree while the business metric is wrong. Reconcile selected outcomes against an independent source such as accepted orders or completed subscriptions.
The activation metrics guide helps define the business outcome. The sample ratio mismatch guide owns the detailed diagnosis of assignment and analyzed-population imbalance; this article keeps that check within the larger validation workflow.
A practical A/A test specification
Write the specification before reading outcome differences. It should be short enough for the implementation owner and analyst to agree on the same experiment.
- Define the eligible population and randomization unit, such as a signed-in user or an account.
- State the intended split and ensure both groups receive the same product behavior.
- Identify the exact evaluation point that creates an exposure record.
- Define each metric, including the denominator, outcome window, exclusions and missing-data treatment.
- Select the analysis method, error threshold and stopping rule before examining results.
- Define operational acceptance cases and the smallest measurement discrepancy that matters to the decision.
- Assign owners for identity, exposure, metric computation and the release decision.
A user-level split should normally be analyzed at a compatible unit. Ten events from one user are not ten independent users. Account-level collaboration can also create dependence between people, so a user-level calculation may be inappropriate when account behavior is the real unit.
Keep the same inclusion rules on both sides. Filtering one group to people with a recorded outcome while retaining all exposed users in the other creates a denominator mismatch. A metric should specify how it treats an eligible user with no outcome, an unobserved outcome and an event that arrives late.
Live setup and exposure evidence
Statsig's current tutorial implements an A/A test with a feature gate. Its example uses a 50% pass rule, evaluates the gate in the application and leaves the visible experience unchanged. The evaluation supplies exposure evidence for the results. See the live A/A setup.
For a comparable implementation, create the named gate or experiment in an evaluation environment, call it at the intended decision point and confirm that neither result changes the user experience. Then inspect known identifiers and events before expanding to the agreed live population.
| Hypothetical case | Expected behavior | Evidence location |
|---|---|---|
| Same user returns | Same assignment under the chosen identity policy | Assignment or evaluation log |
| Eligible user reaches the tested feature | Exposure recorded at the defined point | Exposure stream |
| User completes the outcome | One eligible outcome under the metric definition | Event and business records |
| User performs no outcome | Correct denominator with no invented success | Analyzed population |
| Outcome arrives late | Documented inclusion or maturity treatment | Metric processing output |
Do not force a tiny hand-picked set of identifiers to split exactly in half. Inspect deterministic behavior for those fixtures and use the appropriate population-level allocation check for the collected sample. A balanced pair of totals can still conceal a broken subgroup.
The tracking plan guide helps preserve the event contract. Include experiment identifier, assignment, identity and relevant timestamps in the accepted evidence without copying unnecessary personal information into debugging exports.
A fixed-horizon numerical example
Assume a synthetic A/A test has two independent groups of 10,000 eligible users. Each user contributes one binary outcome after the same completed observation window. Group A has 1,000 successes; group B has 1,040. The analysis was specified in advance as a two-sided, fixed-horizon large-sample test of equal proportions, with alpha 0.05.
| Synthetic quantity | Group A | Group B | Comparison |
|---|---|---|---|
| Eligible users | 10,000 | 10,000 | Equal sample counts |
| Successful users | 1,000 | 1,040 | Forty additional successes in B |
| Observed outcome rate | 10.00% | 10.40% | B minus A: 0.40 percentage points |
The pooled outcome rate is 2,040 divided by 20,000, or 0.102. The standard error for the null test is approximately 0.004280. Dividing the observed rate difference of 0.004 by that standard error gives a z statistic of approximately 0.9346 and a two-sided p-value of approximately 0.3500. The calculation follows NIST's difference-of-proportions test.
The following Python example uses only the standard library. It is a reproducible calculation for the stated synthetic counts, not a replacement for an experiment platform's sequential, clustered or variance-reduced analysis.
from math import erfc, sqrt

success_a, users_a = 1000, 10000
success_b, users_b = 1040, 10000
alpha = 0.05

rate_a = success_a / users_a
rate_b = success_b / users_b
pooled = (success_a + success_b) / (users_a + users_b)
null_se = sqrt(pooled * (1 - pooled) * (1 / users_a + 1 / users_b))
z = (rate_b - rate_a) / null_se
two_sided_p = erfc(abs(z) / sqrt(2))

print(f"Difference: {(rate_b - rate_a) * 100:.2f} percentage points")
print(f"z: {z:.4f}; p: {two_sided_p:.4f}")
print(f"Rejection at planned alpha: {two_sided_p < alpha}")
The output is a 0.40-percentage-point difference, z = 0.9346, p = 0.3500 and rejection = False. That means this test does not reject equal outcome proportions at its planned threshold. It does not establish equal performance, absence of bias or correct instrumentation.
This approximation needs suitable counts and the stated independence assumptions. Rare outcomes, repeated observations from the same person and account-level randomization require appropriate analysis. Do not apply the snippet to a revenue average or treat its inputs as raw event counts.
Significance, precision and diagnostic judgment
A p-value describes compatibility with a specified statistical model; it is not the probability that the setup is correct. The American Statistical Association's statement also cautions against making a business conclusion from a threshold alone.
Read the estimated discrepancy and its uncertainty alongside the p-value. If a small measurement bias would materially change product decisions, the sample must provide enough precision to investigate that bias. A wide uncertainty interval containing zero can also contain discrepancies the team would consider unacceptable.
For a formal equivalence claim, define a meaningful equivalence margin and use a suitable equivalence procedure. Ordinary failure to reject a difference is not an equivalence test. See Lakens's equivalence-testing primer. A release record can instead state exactly which operational cases passed, which statistical analysis was performed and which limitations remain.
Likewise, a significant A/A result deserves investigation rather than an automatic declaration that the software is broken. Confirm the experience was truly identical, inspect assignment and measurement, and apply the chosen multiplicity and stopping rules. Preserve the surprising result rather than restarting repeatedly until the dashboard looks reassuring.
False positives and multiple metrics
For a correctly calibrated test of a true null at alpha 0.05, the nominal false-positive rate is 5% over repeated applications under its assumptions. That is not a promise that exactly one of every twenty metrics in one experiment will be significant. Approximate, discrete, sequential and adjusted procedures have their own calibration and interpretation.
Consider an explicitly hypothetical family of twenty independent, valid null tests, each with a 5% false-positive probability and no multiplicity adjustment. The probability of at least one false positive is 1 minus 0.95 to the twentieth power, approximately 64.15%. The expected number is one, but the observed number can be zero, one or more.
The independence assumption belongs beside that calculation. Real experiment metrics often share users and outcomes, so the 64.15% figure is not a universal scorecard prediction. Decide which metrics form the decision family and apply the correction or joint procedure chosen for that family. Microsoft's research on correlated experiment metrics explains why metric dependence matters.
Treat exploratory slices as exploratory. Searching every country, browser and hour after seeing the result creates additional opportunities for a misleading signal. A useful investigation can still examine those slices, but it should distinguish debugging evidence from a newly confirmed statistical conclusion.
Duration, stopping rules and outcome maturity
There is no universal one-week or two-week A/A duration. Plan around traffic, the chosen unit, the precision required, the outcome window and relevant operating cycles. A weekly purchase process may need different coverage from an immediate signup event, and recently exposed users may need time to finish the outcome window.
Under the fixed-horizon method used in the example, analyze the planned completed sample according to the prespecified rule. Repeatedly testing and stopping when a p-value crosses 0.05 changes the false-positive behavior. Operational monitoring for missing events or a broken page can continue; it should not silently become an unadjusted statistical stopping rule.
If early statistical decisions are necessary, select a method designed for that use. Statsig documents sequential testing that adjusts its inference for early looks; its result should not be expected to match the fixed-horizon snippet above. See sequential-testing guidance.
Offline calibration and shared errors
Offline A/A analysis repeatedly splits existing observations and runs them through the metric and statistical pipeline. It can help detect problematic metric distributions, duplicates or implementation errors without delivering a new live variation. Microsoft describes this approach using hashed identifiers and repeated seeds. See simulated A/A validation.
Preserve the intended unit when resampling. Splitting individual events from one person across both groups can make the offline exercise unlike the production experiment. Retain the observation window and the same metric transformation used by the real analysis.
Offline evidence cannot establish that a browser calls the SDK at the right time or that both live code paths log the same events. Pair it with live fixtures when those components change. Conversely, a single live A/A run is a weak basis for claiming that a statistical engine is calibrated across every metric distribution.
A/A diagnosis and repair
| Symptom | Candidate explanation | Repair evidence |
|---|---|---|
| Missing exposures | Evaluation or logging path absent | Known user appears at the intended point |
| Unexpected allocation | Identity, eligibility or analysis filtering problem | Reconciled assigned, exposed and analyzed populations |
| Both groups disagree with orders | Shared metric or source error | Business-record reconciliation |
| Isolated significant metric | Chance, multiplicity or a real measurement discrepancy | Preserved result plus planned diagnostic review |
| Repeated unstable results | Identity changes, delayed outcomes or method mismatch | Repeatable unit and outcome-window behavior |
Repair the identified cause and repeat the affected acceptance cases. Document whether the original sample remains interpretable after the change; restarting or combining incompatible periods should be an explicit analytical decision.
A/A validation workflow
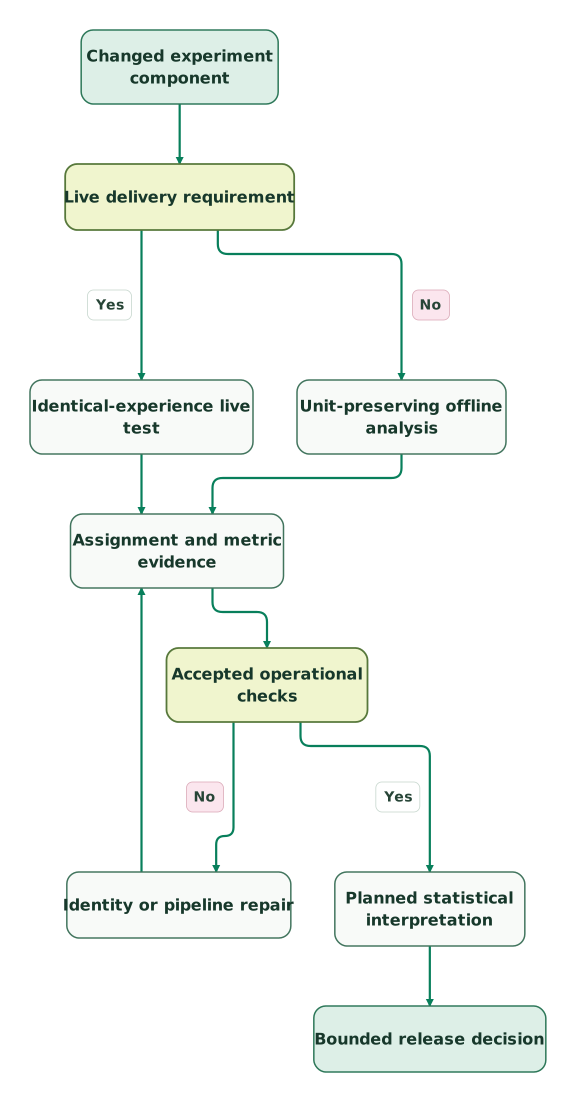
Read diagram as text
- Changed experiment component to Live delivery requirement.
- Live delivery requirement to Identical-experience live test: Yes.
- Live delivery requirement to Unit-preserving offline analysis: No.
- Identical-experience live test to Assignment and metric evidence.
- Unit-preserving offline analysis to Assignment and metric evidence.
- Assignment and metric evidence to Accepted operational checks.
- Accepted operational checks to Identity or pipeline repair: No.
- Identity or pipeline repair to Assignment and metric evidence.
- Accepted operational checks to Planned statistical interpretation: Yes.
- Planned statistical interpretation to Bounded release decision
A/A testing checklist
- A named component or change requiring validation.
- Identical intended experiences and a stable randomization unit.
- Known exposure and outcome fixtures with expected records.
- Matching eligibility, denominators and observation windows.
- A prespecified analysis method, alpha and stopping rule.
- An explicit metric family and multiplicity treatment.
- Independent reconciliation for errors shared by both groups.
- A duration and precision plan appropriate to the decision.
- Preserved surprising results and a named repair owner.
- Revalidation after the affected implementation changes.
The tracking plan audit skill helps retain the measurement contract. Use the dashboard templates tool to organize the evidence view, with allocation, missingness and outcomes visible separately. Tool selection belongs in the experimentation platforms guide.
Keep reading
Browse all Product Analytics guides
 Product Analytics
Sample Ratio Mismatch: Diagnose an A/B Test Before Reading Lift
Diagnose sample ratio mismatch across assignment, exposures and analysis filters, with a checked Python example, missing-user scenario and recovery criteria.
Jafrin Akter AloLast updated 9 min read
 Product Analytics
Experimentation Platforms in 2026: 15 Tools Compared by Price, Stats and Team Fit
Pick an experimentation platform by who runs tests and where metrics live. 15 tools compared on price, free limits and stats, plus cost at 3 traffic levels.
Jafrin Akter AloLast updated 54 min read
 Product Analytics
North star, activation and retention metrics for SaaS
Choose SaaS metrics that represent customer value. Define activation and retention, avoid misleading cohorts and test improvements with worked examples.
Jafrin Akter AloLast updated 13 min read
Product analytics
See the implementation scope, deliverables and acceptance checks.
Questions people ask
Does an A/A test with p above 0.05 establish that assignment is unbiased?
An A/A test with p above 0.05 does not establish unbiased assignment. It only fails to reject the tested null under that analysis, sample and threshold. Inspect identity stability, eligibility and exposure records separately, and consider whether the sample has useful precision. Both groups can also share a measurement error that a between-group comparison cannot reveal.
Can one significant A/A metric occur without an implementation defect?
One significant A/A metric can occur without an implementation defect. A valid test can produce a false positive, and testing many metrics adds opportunities for such results. Check the prespecified metric family, stopping rule and analysis assumptions before interpreting the signal. Then investigate assignment and measurement evidence without deleting or repeatedly rerunning the inconvenient result.
Can a fixed-horizon A/A calculation reproduce a sequential platform result?
A fixed-horizon A/A calculation should not be expected to reproduce a sequential platform result. Sequential methods change the inference to account for supported early decisions, while the simple example here assumes a planned final analysis. Confirm the platform's method and settings before comparing p-values. See Statsig's sequential-testing documentation.
Does an offline A/A test validate the live browser exposure call?
An offline A/A test does not validate the live browser exposure call. It exercises the sampled data, metric definitions and statistical pipeline after collection. A live SDK call, page-loading behavior or missing event needs direct implementation evidence. Use unit-preserving offline analysis alongside known live cases when both collection and analysis are part of the change.
Should an A/A test end after a universal number of calendar days?
An A/A test should end according to its agreed design rather than a universal calendar duration. Traffic, randomization unit, outcome maturity, operating cycles and required precision determine the useful window. Record those assumptions before looking at differences. A long run with an inappropriate unit or incorrect event contract can still provide misleading evidence about the setup.
Sources

Written by
Jafrin Akter AloData Engineer and Co-founder at Martechdevs and Growth and Analytics Partners
Jafrin writes practical guides to marketing technology, customer data, analytics and AI workflows. Martechdevs is a Growth and Analytics Partners company.