
Good ROAS Targets: Margins, Measurement and Growth
A good ROAS covers the costs behind the sale and leaves the contribution your business needs within an acceptable payback period. There is no universal multiple that establishes this for every advertiser. Start with your margin and revenue definition, then compare measured performance with a target that uses the same attribution and time basis.
On this page
ROAS target economics
These hypothetical thresholds show the effect of contribution margin before advertising, not industry benchmarks.
| Contribution margin before ads | Break-even revenue ROAS | Equivalent percentage | Scope |
|---|---|---|---|
| 20% | 5.00× | 500% | Advertising consumes all pre-ad contribution |
| 30% | 3.33× | Approximately 333% | Same cost boundary |
| 40% | 2.50× | 250% | Same cost boundary |
| 60% | 1.67× | Approximately 167% | Same cost boundary |
The margin here is net revenue minus the variable costs assigned to those sales, divided by net revenue. Define those costs explicitly: product cost, payment fees, variable fulfillment and expected returns handling may all matter. Fixed overhead, tax and financing are excluded from this first table, so its break-even point is not a claim of company-wide profitability.
Measurement needs the same care as the target. If your ad platform records gross checkout value while finance uses revenue after refunds, the two teams may be discussing different ratios. Our analytics and tracking service can connect the event definition, order reconciliation and reporting contract before the target becomes a bidding instruction.

Revenue and value definitions
Revenue ROAS is revenue attributed to the advertising divided by the corresponding advertising spend. A 4× revenue ROAS means $4 of attributed revenue for each $1 of ad spend. Expressed as a percentage, the same ratio is 400%. It does not mean a 400% profit margin.
Use the ROAS calculator for the ratio, but first write down what the numerator contains. Decide whether it is gross order value, net sales, collected revenue, predicted customer value or another assigned value. Keep the currency and tax treatment consistent with the cost model.
Google Ads can optimize conversion value using values such as revenue or profit-related amounts. Transaction-specific values and fixed values are different setup choices. Consequently, a platform's conversion value divided by cost is only a revenue ROAS when the supplied conversion value represents the intended revenue measure. Google conversion values.
For lead generation, a form submission assigned a value of $100 is not automatically $100 of booked revenue. The number may be a planning estimate or bidding signal. Label it as such and compare it with qualified leads, closed business and collection outcomes as those become available.
Separate the purpose of the metric from its display format. A revenue ratio, a contribution ratio and a lead-score-to-cost ratio can all look like multiples in a dashboard. They require different interpretations and should not share one unexplained target.
Margin-based thresholds
Let revenue be R, advertising spend be A and pre-ad contribution margin be m. The contribution available after advertising is:
Post-ad contribution = R × m − A
Revenue ROAS = R ÷ A
Break-even revenue ROAS = 1 ÷ m
The final relationship follows by setting post-ad contribution to zero. It requires a positive margin and the same revenue and cost boundaries throughout. If the margin is zero or negative, no finite positive ROAS makes this simplified contribution model break even.
The break-even ROAS calculator helps explore this relationship. Replace its assumptions with the actual product mix and variable costs. A catalog-wide average can be useful for planning, but it may hide campaigns that sell different combinations of high-margin and low-margin products.
Identical ROAS, different outcomes
Consider two hypothetical campaigns, each with $4,000 net revenue and $1,000 advertising spend. Both report 4× revenue ROAS. Their economics differ because the contribution margin before advertising differs.
| Hypothetical campaign | Pre-ad margin | Pre-ad contribution | Contribution after $1,000 ads |
|---|---|---|---|
| Lower-margin product mix | 20% | $800 | −$200 |
| Higher-margin product mix | 50% | $2,000 | $1,000 |
The first campaign does not cover its advertising within this defined cost boundary. The second leaves $1,000 for fixed overhead and other requirements. Neither row is a measured client result, and the remaining amount is not automatically net profit.
This is why a borrowed 4× target is a weak approval rule. Ask what margin and cost assumptions made the number useful in its original context. If those assumptions are unknown, use the benchmark as a question to investigate, not a target to impose.
Contribution targets above break-even
Suppose the business wants a specified fraction of revenue remaining after variable costs and advertising. Let that required post-ad contribution fraction be p. Under the same simplified assumptions:
Required revenue ROAS = 1 ÷ (m − p)With a 40% pre-ad margin and a required 10% post-ad contribution, the threshold is 1 ÷ (0.40 − 0.10), or approximately 3.33×. At $10,000 revenue, the model permits $3,000 of ad spend and leaves $1,000 after $6,000 of variable costs.
The formula requires m to exceed p. If the required contribution equals or exceeds the pre-ad margin, positive advertising spend cannot satisfy that target under these assumptions. Also distinguish a percentage-of-revenue target from a fixed overhead amount: covering $10,000 of monthly overhead requires a volume plan as well as a ratio.
Returns and revenue quality
A target built on net revenue should be assessed against net revenue. In a hypothetical example, $5,000 of booked sales against $1,000 of ad spend appears to produce 5× ROAS. If $800 is later refunded, the corresponding net revenue becomes $4,200 and the ratio becomes 4.2×. Recalculate contribution using the actual associated costs rather than assuming refunds leave the original margin unchanged.
Keep an order-level record of refunds, cancellations and duplicate submissions. The purpose is to explain the revenue total, not merely to make two dashboard numbers match. A timing difference may be legitimate; a duplicate order or missing refund requires a different response.
Google Ads supports conversion adjustments that restate a value or retract a conversion, with order identifiers used to locate the original conversion. The applicable upload route and constraints should be reviewed before implementing an adjustment process. Google conversion adjustments.
Do not change the business definition quietly halfway through a comparison. If a team moves from gross sales to net revenue or from first-order revenue to a cohort measure, record the effective date and show the impact on the target. A lower ratio after correcting the definition can be a more useful measurement.
Benchmark comparisons
A benchmark is useful when its population and measurement method resemble the decision you face. Before comparing your number with a published average, check the industry, product margin, order size, customer mix, channel, geography and reporting period. Also check whether the reported value includes view-based credit, repeat purchases, refunds or modeled value.
| Comparison dimension | Required alignment | Common mismatch | Better response |
|---|---|---|---|
| Customer mix | Acquisition versus existing customers | Retention campaigns compared with prospecting | Separate the cohorts |
| Revenue basis | Gross, net or predicted value | Gross benchmark against net reporting | Reconcile the value definition |
| Attribution | Model, eligible interactions and window | Different credit rules | Report the difference explicitly |
| Time horizon | Comparable conversion maturity | Yesterday against a settled month | Use a mature comparison period |
| Cost scope | Media spend and any added costs | Platform media ratio against fully loaded cost | Name each ratio separately |
A channel that reaches people already familiar with the brand may show a different ratio from one introducing the product to new customers. That does not automatically establish which deserves the next dollar. The task is to understand contribution and additional demand across the relevant customer journey.
Use marketing attribution models to document credit rules. If the question is whether advertising caused additional sales, the attribution, MMM and incrementality comparison helps distinguish that question from assigning credit to observed conversions.
Avoid adding the revenue attributed by several platforms as though each total represents separate orders. Reconcile the underlying sales and explain overlapping claims. A blended business ratio can provide a separate view, but it should be labeled according to its own numerator and denominator.
Conversion timing
A recent period can look weaker because advertising spend has already been recorded while some customers have not converted. Google describes this conversion delay explicitly and provides reporting to inspect it. A mature comparison period is especially important for products with a longer consideration or sales cycle. Google conversion delay guidance.
Define a review schedule that fits the observed delay. Keep early signals visible, but distinguish provisional results from settled performance. Reopening the same cohort after a suitable interval can show whether its value is still developing or whether the initial concern remains.
Date grouping also matters. Google Ads offers standard conversion reporting and columns organized by conversion time. Mixing an interaction-date cost view with a different revenue-date view can produce a ratio that answers a different question from the one intended. Google conversion reporting.
This does not mean all decisions must wait indefinitely. Operational failures, broken checkout paths and incorrect conversion values can be investigated immediately. The distinction is between repairing faulty measurement and judging campaign economics before the relevant revenue has had time to appear.
Growth and marginal returns
A good average ROAS does not establish that additional spend will have the same return. Evaluate the extra revenue and contribution associated with a proposed increase, while acknowledging that a simple before-and-after comparison may also reflect seasonality, pricing or other changes.
For a hypothetical planning example, suppose an additional $1,000 of advertising is expected to produce $3,000 of net revenue at a 40% pre-ad margin. That implies $1,200 of pre-ad contribution and $200 remaining after the added advertising. The incremental planning ratio is 3×, even if the existing campaign average is higher. This is an assumption to test, not a forecast guaranteed by the historical average.
Volume matters alongside efficiency. A campaign can achieve a high ratio at a very small scale while contributing little absolute cash. Another may have a lower ratio that still clears the required contribution threshold at a useful volume. Compare both the ratio and the dollars remaining under the agreed cost model.
Keep constraints visible: inventory availability, service capacity, cash timing and customer quality can limit a sensible expansion. A ratio alone does not determine whether the business can fulfill more orders or fund a longer payback period.
Platform target settings
A Google Ads Target ROAS setting is an average conversion-value objective, not a guarantee. Google recommends using business goals and historical performance as references, excluding the recent conversion-delay period when evaluating results. It also warns that an excessively high target can limit traffic. Target ROAS bidding.
Translate the economic target into the platform's actual value definition before changing it. If the platform receives profit-related values while the planning sheet uses revenue, the same numeric target would mean something different. Confirm the selected conversion goals as well as the value payload.
For lead businesses, choose a meaningful stage and value signal rather than combining every intermediate step into an unexplained revenue estimate. Google's value-based bidding guidance emphasizes meaningful values, measurement capability and a defined optimization stage. Value-based bidding guidance.
Agree on one controlled change and its review criteria. Record the prior setting, reason, expected tradeoff and evaluation period. A plan that changes targets, budgets, conversion definitions and creative simultaneously makes the outcome harder to interpret.
Target review workflow
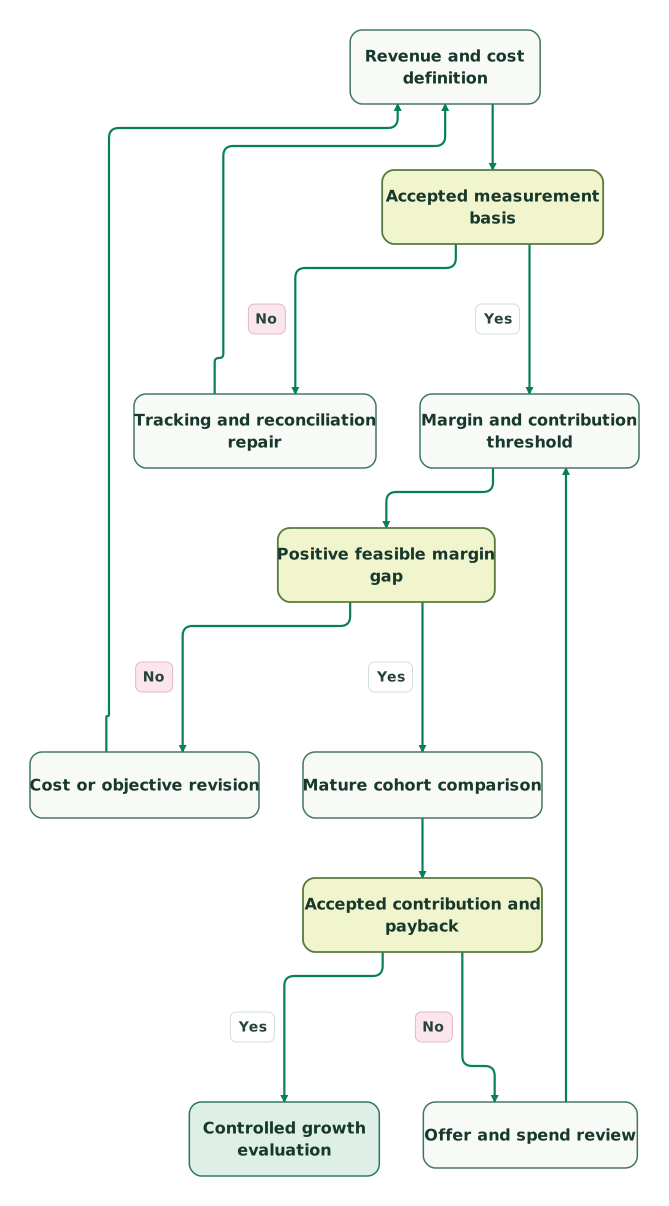
Read diagram as text
- Revenue and cost definition to Accepted measurement basis.
- Accepted measurement basis to Tracking and reconciliation repair: No.
- Tracking and reconciliation repair to Revenue and cost definition.
- Accepted measurement basis to Margin and contribution threshold: Yes.
- Margin and contribution threshold to Positive feasible margin gap.
- Positive feasible margin gap to Cost or objective revision: No.
- Cost or objective revision to Revenue and cost definition.
- Positive feasible margin gap to Mature cohort comparison: Yes.
- Mature cohort comparison to Accepted contribution and payback.
- Accepted contribution and payback to Offer and spend review: No.
- Offer and spend review to Margin and contribution threshold.
- Accepted contribution and payback to Controlled growth evaluation: Yes
The repair path returns to the definition whenever the revenue or cost basis changes. An offer or spend review returns to the margin calculation because a discount, product mix change or new acquisition cost can alter the threshold itself.
ROAS review checklist
- Revenue, conversion value and contribution are labeled separately.
- Currency, refunds and tax treatment match the cost model.
- Variable costs and excluded fixed costs are documented.
- The break-even threshold uses a positive pre-ad margin.
- Any required post-ad contribution has a feasible margin gap.
- Attribution and conversion-date settings are recorded.
- Recent cohorts are marked provisional where appropriate.
- New and existing customer economics are reviewed separately.
- Proposed growth includes an incremental contribution assumption.
- A named owner and review date accompany any target change.
The attribution model selector skill can help clarify which measurement view supports the decision. Keep the economic threshold and measurement definition together so that later reporting or product changes do not silently invalidate the target.
Keep reading
Browse all Tracking & Attribution guides
 Tracking & Attribution
What Is an Attribution Model? Marketing Models and Examples
Understand what an attribution model does, compare credit for the same purchase, and choose reporting rules without confusing attributed revenue with causal impact.
Jafrin Akter AloLast updated 15 min read
 Tracking & Attribution
Attribution vs marketing mix modeling vs incrementality: which does a small team need?
Choose the right marketing measurement method. Compare attribution, lift tests and MMM by data requirements, statistical uncertainty and business economics.
Jafrin Akter AloLast updated 16 min read
 Tracking & Attribution
HockeyStack Alternatives for B2B Attribution, Account Signals and Cost
Compare HockeyStack alternatives Dreamdata, Ruler Analytics and Factors.ai by revenue definitions, account identity, product scope and migration economics.
Jafrin Akter AloLast updated 11 min read
Analytics & tracking
See the implementation scope, deliverables and acceptance checks.
Questions people ask
Is a 4× ROAS always profitable?
No, a 4× revenue ROAS is not always profitable. At a 20% contribution margin before advertising, $4,000 of revenue creates only $800 to cover $1,000 of ad spend. At a higher margin the same ratio can leave positive contribution, but fixed overhead, taxes and other excluded costs still need consideration.
Can a business use one ROAS target for every product?
It can use a portfolio target, but that target may hide meaningful differences between products. Compare margin, returns, fulfillment cost and customer mix before applying it to individual campaigns. A shared target is easier to defend when the product economics are similar or when the team explicitly accepts the portfolio tradeoff.
Should predicted lifetime value replace first-order revenue in ROAS?
Only when the value definition and uncertainty are explicit. Predicted lifetime value can support a longer-term planning or bidding objective, but it is not collected revenue. Keep realized cohort revenue, forecast value and payback timing visible separately so the business can judge whether the acquisition strategy fits its cash constraints.
Does increasing the Target ROAS setting guarantee a better result?
No, a higher target does not guarantee better realized performance or more contribution. It changes the bidding objective and can restrict available traffic. Review the value signal, conversion maturity and business threshold first, then assess a controlled change against both efficiency and volume rather than assuming the setting is an achieved result.
Can two platforms both claim the same sale in their ROAS reports?
Yes, their attribution rules can assign credit to the same underlying sale. Do not add those attributed revenue totals as though they were distinct orders. Reconcile business revenue independently, document each platform's attribution basis and use a separate measurement design when the question concerns incremental sales caused by advertising.
Sources

Written by
Jafrin Akter AloData Engineer and Co-founder at Martechdevs and Growth and Analytics Partners
Jafrin writes practical guides to marketing technology, customer data, analytics and AI workflows. Martechdevs is a Growth and Analytics Partners company.