Martech Stack Cost: Calculate Total Cost of Ownership and Explain It to the Board
Data Engineer and Co-founder at Martechdevs and Growth and Analytics Partners
Last updated 14 min read

Martech stack cost includes the licences, usage charges, integration work and people required to keep the stack doing its jobs over a stated period. Build one cost register, separate cash payments from staff capacity, and allocate each cost once to the workflows it supports. Then explain growth through changed rates, volumes and operating effort rather than treating every increase as another software purchase.
What belongs in the total cost of ownership?
Include the work and commitments needed to operate the stack, not just the subscription list. Total cost of ownership (TCO) is most useful when it separates recurring operations, one-time change work and future contractual commitments.
Start with what a martech stack is made of. For a new company, which tools each stage adds and why is a different decision from measuring an established stack's operating cost.
| Cost category | Typical billing or effort unit | Evidence to collect | Keep distinct |
|---|---|---|---|
| Licences and commitments | Seats, editions, minimum contract | Invoice and signed order | Cash payment date versus service period |
| Metered usage | Contacts, events, tasks, rows or tokens | Vendor usage report and rate schedule | Included units versus overages |
| Integration build and change | Project scope or engineering hours | Approved change and delivery record | One-time work versus continuing support |
| Integration maintenance | Investigation, upgrades and recovery hours | Tickets, work logs and owner estimates | Internal capacity versus supplier invoices |
| Shared operations and exit | Administration, security, parallel running and migration | Operating register and retirement plan | Avoidable costs versus commitments that remain |
Use one-off implementation quotes for the build boundary and supplier and staff options for running integrations for continuing ownership. A supplier invoice and the internal time spent reviewing its work can both belong in TCO, but the same person's same hours should not appear twice.
At Martechdevs, we scope martech integration work that replaces fragile point-to-point connections around the workflow and its operating owner. The cost question is whether the new design reduces avoidable work or risk at a defensible total cost.
Why can integration costs grow faster than the tool count?
Each new tool can add connections, usage and operating exceptions to the tools already present. The growth depends on the actual flows, not the number of logos on the stack diagram.
More tools create more possible relationships
With n tools, there are n × (n − 1) ÷ 2 possible unordered pairs. Eight tools have 28 possible pairs; ten have 45. Two additional tools therefore add 17 possible pair relationships.
That is a structural illustration, not a forecast of 45 integrations or a billing rule. A real pair may have no connection, a one-way feed, several object-specific flows or two separately governed directions. Count the flows that actually exist and the effort they require.
The important consequence is ownership. Adding a messaging tool can affect the customer relationship management (CRM) system, product events, consent, billing and reporting. Each interaction introduces rules and failure cases even if its connector was easy to switch on.
Replays and exception handling can increase the meter
Zapier's task rules count successful action steps, including successful error-handler steps and previously successful steps repeated by a full-run replay. Trigger polls do not count as tasks. A failed workflow can therefore lead to more billable successful work during recovery; do not estimate solely from the number of new customer records.
Its pay-per-task rules cap total usage at three times the plan allocation when that billing option is enabled. The ceiling includes the original allocation, rather than adding another three allocations. Beyond the ceiling, work stops; without pay-per-task enabled, the ordinary plan limit governs. Confirm the actual account setting and overage rate.
Compare MCP, API or Zapier for each connection when choosing a route. Model Context Protocol (MCP) gives AI applications access to tools; an application programming interface (API) exposes system operations. Their presence does not remove usage or maintenance costs.
Plan limits can create a step in cost
A limit can force a different plan or paid extension even when the application count stays unchanged. HubSpot's current usage guidelines list privately distributed app daily account limits of 250,000 calls on Free/Starter, 625,000 on Professional and 1,000,000 on Enterprise. Eligible API limit increases add 1,000,000 daily calls each, with a maximum of two. Marketplace OAuth applications have different limits; do not apply this private-app table to every connection.
Before paying for additional capacity, check batching, repeated reads, polling and unnecessary writes. Then include the required entitlement in the cost register. HubSpot's seat, contact and credit pricing belongs beside the API requirements because an integration can depend on several billing units at once.
Packaging and interface changes add work
Zylo's 2026 SaaS Management Index reports average software-as-a-service (SaaS) spend rising 8% while application counts were nearly flat. Zylo attributes the pressure to pricing, packaging and expansion within products. This is vendor research across its dataset, not a benchmark for your marketing stack or proof that every increase has that cause.
API changes create a different cost. Adobe's October 2026 Marketo release notes say that, from 30 September, Get Lead Activities and Get Lead Changes calls using listId fail for static lists containing 10,000 or more leads. An unchanged connector may therefore need investigation, redesign and testing. Include the run work a Marketo instance needs after launch rather than treating its original build as the final integration cost.
Duplicate movement can add cost without adding value
Two pipelines can copy the same customer facts to the same place, while separate teams maintain both. Check whether the duplication provides a deliberate recovery or latency benefit. Otherwise, it may create two usage meters, two reconciliation paths and two opportunities for conflicting writes.
Do not assume removing one pipeline halves the bill. Minimum commitments, included usage and shared infrastructure can leave much of the invoice unchanged. Separate reduced activity from an actual reduction in payable charges.
How should you build the cost register?
Give every cost a stable row, an evidence source and an accountable owner, then link it to the workflows that use it. Start from a stack audit inventory, but extend the inventory beyond tool names.
Keep tool subscriptions and integration flows as related records. If an integration platform charges one shared subscription, record that invoice once and allocate it across flows. Do not copy the full fee into every integration row.
| Register field | What to record | Check that prevents a misleading total |
|---|---|---|
| Owner and service period | Responsible person, period covered and currency | Every amount has a comparable time basis |
| Commitment and payment | Contracted quantity, payment date, renewal and notice dates | Monthly equivalents do not conceal annual cash needs |
| Usage | Billable units, allowance, overage rate and measurement source | Count the vendor's unit rather than your own proxy |
| Operating effort | Internal hours, supplier hours and whether measured or estimated | Separate capacity from cash and avoid duplicate hours |
| Workflow allocation | Named workflows and a rule whose shares sum to 100% | The whole amount appears once in the consolidated total |
| Change and exit | Migration, overlap period, termination work and residual commitments | A proposed saving includes the cost of obtaining it |
Reconcile invoices to accounts payable for the same period. Keep an explicit unallocated row rather than spreading an unexplained charge until it disappears. Usage exports, tickets and owner estimates add detail; they do not replace the financial total.
How should internal time be valued?
Use the organization's loaded labour cost and observed time where available. Show the result as capacity consumed, separately from supplier and software bills. If payroll stays unchanged after a repair, freed hours are an operating benefit rather than an immediate cash reduction.
The US Bureau of Labor Statistics June 2026 compensation data show wages at 70% and benefits at 30% of total compensation for private-industry workers. That is a broad US average, not a technology-team rate. If used as a labelled fallback, a wage rate of USD 56/hour implies 56 ÷ 0.70 = USD 80/hour total compensation. Adding only 30% to the wage produces USD 72.80 and understates this particular assumption.
Use actual payroll data when available and do not apply that US mix indiscriminately to contractors, other countries or a specific role. Overhead and opportunity cost also need their own explicit treatment rather than being hidden inside a convenient hourly rate.
What does quarterly cost growth look like in a worked example?
Separate the cash increase from the extra staff capacity before explaining the trend. The following fictional stack grows from eight tools and twelve maintained flows to ten tools and fifteen flows. Every amount is a planning assumption, not a vendor price or observed customer result.
Operating inventory for four hypothetical quarters. Each maintained flow is assumed to require three internal hours per month at USD 80 loaded cost/hour.
| Quarter | Tools | Maintained integration flows | Internal maintenance hours/month |
|---|---|---|---|
| Q1 | 8 | 12 | 36 |
| Q2 | 8 | 13 | 39 |
| Q3 | 9 | 14 | 42 |
| Q4 | 10 | 15 | 45 |
Monthly USD run cost within each quarter. Licences, usage and supplier support are assumed cash bills. Internal maintenance is valued capacity; all rates and volumes are hypothetical. One-time change work, tax and financing are excluded.
| Cost component | Q1 | Q2 | Q3 | Q4 |
|---|---|---|---|---|
| Licence commitments | 9,000 | 9,100 | 9,250 | 9,450 |
| Metered usage | 1,200 | 1,350 | 1,500 | 1,700 |
| Supplier support | 1,500 | 1,500 | 1,500 | 1,500 |
| Cash run cost | 11,700 | 11,950 | 12,250 | 12,650 |
| Internal maintenance capacity | 2,880 | 3,120 | 3,360 | 3,600 |
| Total resource cost | 14,580 | 15,070 | 15,610 | 16,250 |
For Q1, maintenance is 12 × 3 × USD 80 = USD 2,880/month. Total resource cost is USD 14,580/month, or USD 43,740 for the quarter. Q4 is USD 16,250/month, or USD 48,750 for the quarter.
The monthly resource increase is USD 1,670: USD 450 of licences, USD 500 of usage and USD 720 of internal maintenance. Maintenance represents about 43.1% of that increase. Resource cost rises about 11.5%; cash run cost rises about 8.1%. Reporting only one percentage would conceal the difference between the invoice and the work.
The four-quarter resource total is USD 184,530. Of that, USD 145,650 is assumed vendor/supplier cash spend and USD 38,880 is internal capacity. Preserve these components when comparing the next year or a proposed redesign.
How do you connect the cost to business workflows?
Allocate each cost once using a rule that reflects its use, then show the outcome the workflow supports. Useful bases include measured execution volume, usage, staff time or an agreed shared allocation. Document the choice; a convenient split is not proof of causation.
For illustration, allocate the Q4 resource total across three disjoint cost buckets using assumed 40%, 35% and 25% shares. USD per month. These are management allocations, not measured workflow consumption.
| Workflow | Assumed share | Allocated resource cost/month | Outcome evidence to review |
|---|---|---|---|
| Lead capture and routing | 40% | 6,500.00 | Accepted handoffs, correct ownership and response timing |
| Onboarding and lifecycle | 35% | 5,687.50 | Eligible accounts reaching useful product outcomes |
| Revenue reporting | 25% | 4,062.50 | Reconciled reports available at the decision deadline |
| Total | 100% | 16,250.00 | No duplicated or unallocated amount |
The cost per workflow is a way to ask better questions, not a licence to claim each allocated dollar generated revenue. Use measuring the return marketing produces for benefits, contribution and causal evidence. Keep a failed workflow's cost visible; removing its unsuccessful runs from the denominator can make the remaining unit cost look artificially efficient.
Would a warehouse or integration hub actually reduce the cost?
A hub can remove duplicated transformations and connections, but it also introduces platform bills, shared dependencies and operating work. Price the flows that change, including the destinations that still need updates.
A simple diagram may show roughly one connection per tool around a marketing data warehouse as the hub. In practice, collection, loading and reverse ETL for activation can require separate paths, schedules and permission boundaries. The number of arrows is not the cost calculation.
Consider another hypothetical change to the Q4 stack. Retiring five old maintenance packages removes 5 × 3 × USD 80 = USD 1,200/month of internal effort. The proposed hub adds USD 450/month of external bills and four internal operating hours, or USD 320/month.
Resource cost falls by 1,200 − 450 − 320 = USD 430/month. Cash cost rises by USD 450/month, while net internal capacity falls by USD 880/month. If the transition uses 100 internal hours at USD 80, its USD 8,000 resource cost takes about 18.6 months to offset at the assumed recurring saving. Those savings need the retired work to disappear and the new workload to stay within the estimate.
That can be a reasonable operating decision if the freed capacity and reliability matter. It is not a cash-saving proposal while payroll is unchanged and the vendor bill increases. Present the tradeoff explicitly instead of calling a smaller integration diagram a guaranteed saving.
What should the board see?
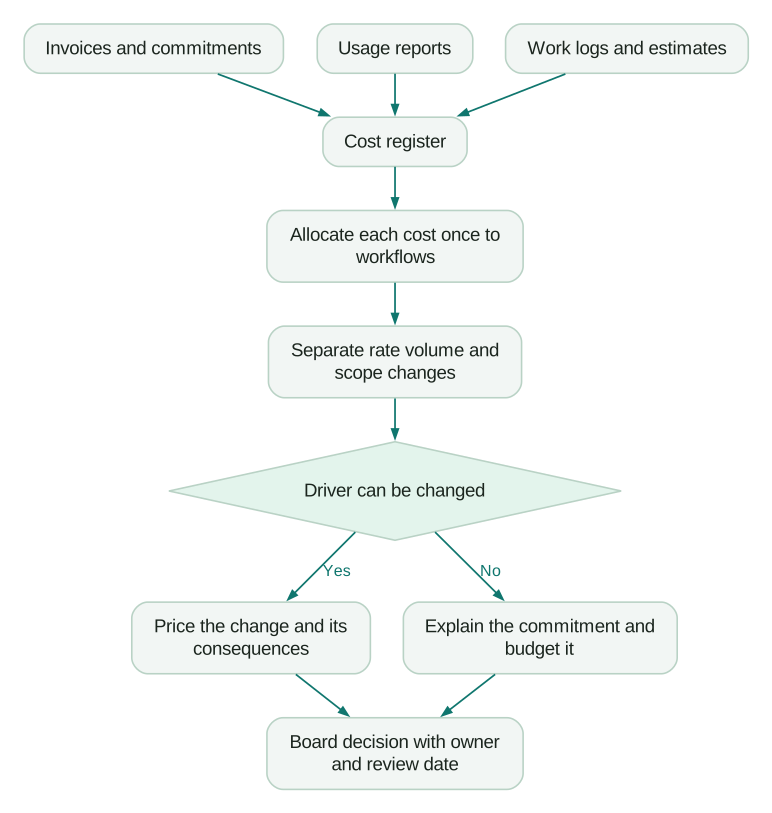
Show the cost trend, its drivers and the specific decision needed. Keep the detailed register available behind the summary so finance can trace every figure.
Use a compact decision record:
- Current position: cash spend, internal capacity, contractual commitments and affected period.
- Explanation: the rate, volume, scope and maintenance changes that account for the increase.
- Operating value: which workflows the spend supports, their owner and the evidence that they work.
- Proposed action: retain, renegotiate, retire or rebuild, with transition cost and dependencies.
- Expected effect: which invoice or workload changes, when it can change and what must happen first.
- Decision and review: the accountable owner, approval needed and date when the assumption will be checked.
A rise in spend may be justified by growth. An unchanged bill may still contain waste. Compare the actual driver with the business decision instead of presenting a percentage increase as inherently good or bad.
Use the business case for a new investment when the fix requires new funding. Forrester's Total Economic Impact policy separates costs, benefits, flexibility and risk and explicitly does not guarantee positive results. Those headings are useful; another vendor's commissioned return figure is not evidence of your own expected return.
Which actions stop avoidable cost growth?
Target a measured driver and preserve the workflow's acceptance criteria while changing it.
| Driver | Action to evaluate | Evidence before claiming a saving |
|---|---|---|
| Duplicate data movement | Retire an unnecessary producer or route | Destination remains complete; the removable charge or work is identified |
| Replayed successful work | Narrow retries and make business actions repeat-safe | Recovery reaches the right result without repeating unrelated successful actions |
| A plan-limit jump | Batch, cache or reduce unnecessary traffic before buying capacity | Required workload stays within the applicable limits |
| Unused entitlement | Reduce seats or scope at the permitted contract point | The invoice or renewal commitment actually changes |
| Unowned maintenance | Assign an owner, operating budget and recovery procedure | Failures and change work are tracked rather than silently absorbed |
Use consolidating tools that move the same data for retirement sequencing. Do not remove the only recovery route or a required data control solely because it looks duplicated in the register.
How do you verify the register before using it for a decision?
Reconcile the financial total, check the allocation and sample the operating evidence. Keep estimates visible so uncertainty cannot be mistaken for a precise invoice.
Checklist
- Every tool and integration has an owner and a stable register reference.
- Currency, service period, payment date and renewal terms are recorded.
- Metered usage follows the vendor's actual counting rule.
- Internal effort and supplier invoices are separate and not duplicated.
- Workflow allocation shares reconcile to the consolidated cost.
- Missing or unexplained spend remains visible.
- Rate, volume and scope changes explain the quarter-to-quarter movement.
- Proposed savings name the invoice or work that can actually disappear.
- Transition costs, shared dependencies and residual commitments are included.
- Each action has an owner, acceptance evidence and review date.
Review the board view quarterly and update the register when contracts, usage or integrations change. Preserve the original baseline when scope changes so the next comparison remains interpretable.
Want a second pair of eyes on your stack? Book a free audit. When integration upkeep is the driver, request a scoped martech integration quote with the affected flows and the operating evidence. Martechdevs projects start at USD 3,000; scope determines the quote and the work to hand over.
Questions people ask
How should unused prepaid credits appear in the cost view?
Show the purchased commitment, cash payment and remaining usable balance separately, with expiry and the vendor's counting rule. Ask finance how the service period belongs in the management view. Do not call the remaining balance a saving simply because no further purchase is needed this month. A credit that expires unused and a credit reserved for planned growth have different operating implications. Keep startup-program expiry terms visible when they subsidize the starting stack.
What if another department pays for a tool marketing uses?
Keep the supplier invoice once in the consolidated register and show marketing's allocated share separately. Record the paying department, allocation basis and workflows served. An internal chargeback is a transfer within the organization, so adding it again to the supplier bill would double-count external spend. Agree the allocation with finance and the service owner before comparing departmental efficiency.
Should experimental AI-tool spending be excluded from the baseline?
Keep actual pilot spending visible, then classify it separately from the continuing operating forecast. Record the owner, trial period, intended decision and stop condition. If the pilot becomes a normal workflow, move its expected usage and support into the recurring view. Excluding experiments entirely can hide a growing cost category; assuming every pilot continues can overstate the next year's commitment.
How should sunk implementation work affect a cancellation decision?
Keep historical implementation cost in the historical record, but compare the costs and consequences that change from now on. Include termination commitments, replacement work and remaining shared infrastructure. An expensive old build is not, by itself, a reason to keep an unwanted tool. Finance should validate the period and accounting presentation while the operating owner verifies what can actually be retired.
How should an acquisition change the cost baseline?
Keep the original businesses' baselines and identify the date the combined operating scope begins. Show acquired subscriptions and staff capacity as a scope addition, rather than presenting the whole increase as a price rise. Model consolidation separately, including inherited renewal commitments and migration overlap. Compare a constant-scope view alongside the combined total so leadership can distinguish organic cost growth from the acquisition itself.
Sources
- Zapier: How task usage is measured.
- Zapier: Pay-per-task billing and maximum usage.
- HubSpot Developers: API usage guidelines.
- Zylo: 2026 SaaS Management Index.
- Adobe: Marketo October 2026 release notes.
- US Bureau of Labor Statistics: June 2026 employer compensation.
- Forrester: Total Economic Impact policy.

Written by
Jafrin Akter AloData Engineer and Co-founder at Martechdevs and Growth and Analytics Partners
Jafrin writes practical guides to marketing technology, customer data, analytics and AI workflows. Martechdevs is a Growth and Analytics Partners company.