
Attribution ROI: What Fixing Tracking Is Actually Worth
Data Engineer and Co-founder, martechdevs
Last updated 12 min read
Fixing tracking creates value when better information changes a decision or improves an outcome. Recovering a missing conversion can make reporting more accurate and give an ad platform a better signal. It does not mean the tracking project created another customer. Build the ROI case around the spending, contribution or work that actually changes.
Last updated: 13 October 2026.
A tracking proposal should answer three questions: what is wrong, which decision the defect affects and how much improvement would cover the cost of fixing it. “You are losing conversions” is not enough. The sales may already exist in your billing system while their advertising context is missing.
This guide separates measurement recovery from commercial improvement, then builds an illustrative break-even model for a company spending $50,000 per month on advertising. All financial inputs and outcomes in the examples are hypothetical.
Identify the loss before assigning it a value
Tracking problems can create several different losses.
A collection defect may prevent a valid purchase event from reaching a destination. An identity gap may leave an event difficult to match. A duplicate event can inflate results. An incorrect value can make a low-margin order look like the best customer. A CRM integration may send every form submission while omitting whether any became qualified opportunities.
Those defects do not have the same fix or economic effect. Adding another data path can improve missing-event coverage while making duplication worse if the two paths are not coordinated.
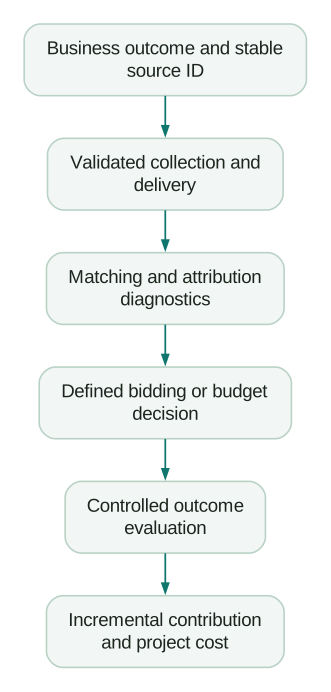
Start with a source-of-truth outcome: a settled order, an accepted opportunity or another explicitly defined business event. Preserve its ID, occurrence time, status, value and relevant adjustments. Then inspect the collection, delivery, matching, attribution and optimization steps separately.
The Google Ads conversion-diagnostics guide provides that investigation order. The purpose is to find the failing stage before pricing a solution.
A better reported CPA can occur without another sale
Imagine a company spends $50,000 in each of two otherwise comparable months. Its business system records 1,000 paid orders in each month. The ad platform reports 700 attributed conversions before a measurement fix and 850 afterward.
Reported conversions increased by 150, or 21.4%. Reported cost per conversion fell from $71.43 to $58.82, a 17.6% decrease.
Yet the business still recorded 1,000 orders. Those dashboard changes alone establish neither incremental orders nor a reduction in advertising cash spending. They may represent improved recognition or attribution of outcomes that already happened.
The figures also should not be labeled “70% and 85% tracking coverage” without defining which orders were eligible for that platform's measurement and attribution rules. A whole-business order total and an ad-attributed conversion count can have different scopes.
Better measurement can still be valuable. It may prevent the team from cutting a productive campaign or help bidding distinguish useful outcomes. That is the next proposition to test, rather than a benefit already proved by the reporting increase.
Read platform uplift claims in their actual scope
Google's enhanced-conversion diagnostics distinguish coverage, match rate and conversion uplift. Its definition of conversion uplift refers to increased conversions reported from user-provided data. That is a measurement metric, not a controlled estimate of additional purchases caused by the implementation. Google enhanced-conversion diagnostics
In a September 2026 announcement, Google reported an average 11% increase in Search conversions for enhanced conversions compared with standard conversion imports. The accompanying source describes internal imported-conversion data from January 2026. The announcement also describes a Data Strength Uplift metric for recovered conversions. Neither figure is a justified default percentage to multiply by your revenue forecast. Google's measurement update
Google also says consent-mode modeling recovers more than half of lost ad-click-to-conversion journeys on average, with results varying by setup and consent rates. Recovery here describes measurement and modeling. It does not mean more than half of otherwise lost sales are created. Google conversion-modeling guidance
Treat platform evidence as support for investigating a mechanism. For a forecast, ask which outcome was measured, whose data was included, the comparison used and whether the claim describes observation, attribution or incremental business performance.
Do not transfer a Search result to YouTube, a web purchase result to qualified leads or an advertiser average to a small account with a different baseline. A platform number without its denominator and population can make a proposal look precise while making it less accurate.
Browser share does not equal recoverable revenue
Browser restrictions and blockers help explain why client-side collection can be incomplete. They do not provide a ready-made financial loss percentage.
For example, WebKit's published explanation of its seven-day rule describes script-writable storage after seven days of Safari use without interaction with the site. That is more specific than saying every Safari conversion disappears after seven calendar days. WebKit's storage-policy explanation
The commercial effect depends on your audience, purchase delay, collection design, consent state and which identifiers remain available. Broad browser-market statistics may not resemble the traffic buying your product.
Do not add browser share, ad-blocker prevalence and consent rejection rates. The groups overlap, the denominators differ and not every person in a group creates a missing event. Nor can every missing signal appropriately be recovered.
Use an event reconciliation to estimate your actual gap. Define the eligible population, classify missing or rejected records and inspect representative examples. Where privacy controls intentionally prevent collection or use, preserve that boundary in the implementation and the forecast.
Put value on a specific change in behavior
There are several defensible routes to value, provided you can evidence them.
Avoided advertising spend: better evaluation supports removing spend that adds insufficient business value, while preserving the outcomes the company needs. A lower budget is a saving only after the change occurs; an attribution report alone cannot prove the spend was unnecessary.
Additional contribution at a comparable budget: better outcome signals or allocation produce additional useful sales. Use contribution after relevant variable costs, and include any additional sales, fulfillment or support burden.
Less operational work: fewer broken reports, manual imports or reconciliation tasks free capacity or reduce external invoices. Separate unchanged staff payroll from actual cash savings, as in the warehouse ROI model.
Reduced exposure to a known defect: a correction prevents repeated duplication, wrong values or a broken conversion action from steering future decisions. Describe the failure and exposure directly. Do not attach an arbitrary percentage of total ad spend to a vaguely stated risk.
Keep overlapping benefits out of the sum. If a campaign's improved contribution calculation already accounts for reduced ad spending, adding the same saving again double counts it. If the reporting team still performs the work, do not count planned time savings as realized.
Calculate the improvement needed to break even
Assume the following proposed project:
- Implementation, testing and handover: $6,000 upfront.
- Ongoing hosting, monitoring and maintenance: $250 per month.
- Evaluation horizon: 12 months.
- Existing advertising spend: $50,000 per month.
These are illustrative inputs, not a service quote. The first-year project cost is $6,000 plus $3,000, or $9,000.
Spread over the 12-month evaluation period, the project needs $750 per month of additional net business benefit before project costs to break even. That is 1.5% of the existing monthly ad spend. The percentage expresses the hurdle; it is not an estimate of recoverable waste.
If an additional paid order contributes $150 after its variable costs and no additional advertising spend is required, the project needs five additional orders per month on average over that horizon. If more ad spend or sales effort is required, include it before using that contribution figure.
The calculation is:
First-year project cost = setup + 12 × monthly operating cost
Average monthly hurdle = first-year project cost / 12
Additional orders required = monthly hurdle / contribution per order

Example:
6,000 + 12 × 250 = 9,000
9,000 / 12 = 750
750 / 150 = 5 additional orders per month
This is undiscounted break-even planning. It does not claim a causal result and does not smooth the actual cash payment: the $6,000 is still paid upfront.
If the business requires payback within three months, the hurdle is different. With benefits starting immediately and costs unchanged, $6,000 divided by three plus $250 equals $2,250 per month, or 15 additional orders per month at the same contribution assumption.
A small headline hurdle can hide a difficult measurement problem. Five incremental orders may be commercially meaningful but hard to distinguish from ordinary variation. Determine whether the evaluation can detect the effect before promising that a short test will settle it.
Build a base case that does not depend on a vendor average
Start with benefits you can substantiate independently: a reporting invoice that will end, a recurring task whose time reduction has been observed or a defined experiment capable of evaluating the proposed allocation change.
Put uncertain bidding and campaign effects into scenarios. For illustration, if a valid evaluation supports $1,200 of additional monthly contribution for all 12 months, gross benefit is $14,400. After the $9,000 project cost, net benefit is $5,400 and undiscounted ROI is 60%.
If there is no commercial or operational benefit beyond more conversions appearing in reports, that same financial model has negative $9,000 net benefit. The measurement improvement may still be a necessary capability, but it has not demonstrated a cash return.
If benefits arrive late, use a monthly cash-flow model. Three months of validation followed by nine months of benefit is not the same as 12 months of benefit. Include temporary parallel systems, additional experimentation cost and the effort of interpreting results.
Write the decision rule before implementation: the project is justified by an identified measurement requirement, by verified operating savings, by a testable commercial hypothesis or by an explicit combination. That is more useful than retroactively choosing whichever metric improved.
Test implementation quality before testing business impact
First establish that the new measurement path represents the intended outcome correctly.
Reconcile unique source IDs through collection and delivery. Check duplicate handling, event names, timestamps, values, currency, refunds and late outcomes. Confirm that the right event is used for optimization and that several lifecycle stages are not being mistaken for several customers.
For lead generation, define which CRM outcome is worth optimizing toward. More form submissions can be a poor result if they are mostly invalid or unsuitable. The enhanced-conversions guide covers the relationship between website data, later CRM outcomes and destination diagnostics.
Check the relevant consent and data-use controls alongside the technical path. Google's consent-mode reference documents how consent settings affect advertising data use and enhanced-conversion measurement. A server connection does not make a denied purpose granted. Google consent-mode reference
Mark the implementation date and preserve the old measurement definition. Do not compare the old reporting denominator with the new one and call the difference business growth. Continue using a stable business outcome source for the commercial evaluation.
Choose an evaluation that answers the decision
A before-and-after dashboard comparison is vulnerable to changes in demand, seasonality, offer, creative, budget and measurement itself. A simultaneous controlled design can reduce some of those problems, but it must match the question.
To test advertising incrementality, compare business outcomes with and without the advertising exposure under an appropriate experiment. Google's Conversion Lift documentation describes controlled user or geographic studies and notes that access is not available to every account. Google Conversion Lift
To test a bidding or allocation change enabled by better data, preserve a common outcome measurement across comparison groups. Do not give one group better outcome detection and mistake the difference in observation for the effect of the decision.
To test the tracking integration itself, begin with event-level correctness, eligible coverage, delay and duplication. That is a technical validation, even if it improves the data available for a later commercial experiment.
Scope the population, unit of assignment, outcome window, budget, expected detectable effect and stopping rule in advance. Check cross-group contamination and allow time for conversion lag. A campaign test with too few outcomes may be inconclusive rather than evidence of no value.
Historical research explains why the distinction matters. The eBay field experiments found substantial substitution between paid and organic brand-search traffic in that setting, with different results across user groups for non-brand search. That does not prove brand advertising never works; it shows why credited demand and incremental demand can differ. eBay paid-search research
A separate study comparing observational methods with 15 Facebook advertising experiments found that the observational approaches often failed to reproduce experimental effects. Those results do not supply a universal correction factor for today's dashboards. They support evaluating causal claims with an appropriate design. Advertising measurement research
The attribution and over-crediting guide develops those limitations and the decisions they affect.
Buy a measurable scope of work
A useful proposal names the defects to fix, the event and value definitions, the systems involved, acceptance evidence, monitoring ownership and the commercial decisions the work should support.
Ask for separate milestones: verified technical implementation, stable reporting and evaluation of the intended business change. Do not make a developer guarantee revenue from factors they do not control, and do not accept a green diagnostics screen as proof that the financial case succeeded.
The lowest-cost useful project may be correcting a duplicated purchase event, choosing the right primary conversion action or sending qualified CRM outcomes. A server-side rebuild is justified when the identified failure and operational requirements call for it. Scope the solution from evidence.
ROI checklist
- The defect and affected decision are specific.
- Business outcomes have a stable definition independent of the new reporting method.
- Measured conversion recovery is separate from incremental sales or contribution.
- Setup, ongoing costs, validation time and rollout delay are included.
- Break-even improvement is calculated from the company's own economics.
- Benefits do not double count saved spend, margin or staff time.
- Technical acceptance and commercial evaluation use different success criteria.
- Uncertain results, privacy boundaries and ongoing ownership are explicit.
If you need to turn the evidence into a bounded project, analytics and tracking implementation can begin with the event reconciliation and decision the business needs to improve. That gives both the implementation and its ROI claim something concrete to stand on.
Questions people ask
Does recovering conversions increase revenue?
It can improve measurement of sales that already occurred. Additional revenue requires a subsequent effect, such as a better bidding or budget decision, and evidence that the outcome changed. Do not multiply recovered conversions by average order value and label the result new revenue.
Is server-side tracking worth it for a small advertising budget?
It depends on the identified defect, implementation cost and operational need. Calculate the improvement required to cover the complete project, then check whether a simpler correction would address the problem. A large advertising budget does not automatically prove the project is valuable, either.
Can I use Google's enhanced-conversion uplift in my forecast?
Use it as contextual evidence about the measurement mechanism, with its stated population and definition. Google's diagnostics describe uplift in reported conversions. Your commercial forecast needs your own eligible event gap, costs and evidence of a business effect; the platform average is not a guaranteed sales increase.
What should I measure after fixing tracking?
First measure event correctness, eligible coverage, duplication, delay and value accuracy. Then evaluate the intended business decision using a stable source outcome, including qualified opportunities or contribution where appropriate. Keep the implementation date and measurement-definition change visible in reporting.
How do I calculate a simple tracking-project break-even point?
Add setup and operating costs over the chosen horizon, then divide by the number of benefit-bearing months. Compare that hurdle with verified savings or additional contribution after relevant costs. For an order-based scenario, divide by contribution per additional order, and account for rollout delay and uncertainty.
Sources
Written by
Jafrin Akter AloData Engineer and Co-founder, martechdevs
Jafrin Akter Alo is a data engineer and co-founder of martechdevs, where the team has delivered 74+ martech, data and growth stack implementations.