AI agent for data quality: triage marketing data alerts before anyone trusts the dashboard
Data Engineer and Co-founder at Martechdevs and Growth and Analytics Partners
Last updated 16 min read
An AI agent for data quality should turn an alert into an evidenced finding: what changed, which decisions are affected, what remains uncertain and who should act. Start with existing monitors and a fixed investigation order. Give the agent enough access to investigate, then require separate authority and verification for any proposed repair.
Product access rules and API documentation were checked on this date. The incident, prompt skeleton and evaluation method below are illustrative; they have not been run against a client system.
What should a data-quality agent do after an alert fires?
It should investigate the alert, classify the likely problem and prepare a useful next step. Detection tells you a number is unusual or a rule failed. Triage determines what evidence supports a cause and which owner needs that evidence.
The marketing data quality guide covers the monitors, thresholds and owners this workflow assumes already exist. This article covers the agent's investigation after a signal arrives, within the wider model of agentic marketing operations.
A good result might say: “The email signup path stopped emitting the agreed event after release X; the Google sign-in path still works; here is the failing browser fixture and the proposed code change.” A poor result says “tracking issue detected” and leaves the same investigation for a person to repeat.
Our custom martech AI agent service connects that investigation to your metric definitions, owners and evidence sources. The initial scope can remain read-only: identify, explain and draft. Publishing GTM, backfilling records, redefining a metric and closing the incident are separate actions.
| Output stage | What it establishes | What it does not establish |
|---|---|---|
| Alert | A threshold, pattern or validation rule triggered | That the business deteriorated |
| Investigation | Evidence supports or weakens specific explanations | That the most recent change caused the problem |
| Proposed repair | A reviewable action may address the evidenced mechanism | That anyone approved or executed it |
| Execution receipt | A particular operation ran against a target | That the target now behaves correctly |
| Verified recovery | Tests and readback support the intended state | That every downstream report or customer outcome recovered |
Keep these stages in the incident record. An agent that cannot access deployment history should identify that gap instead of silently upgrading a correlation into a diagnosis.
In what order should the agent investigate an alert?
Check whether the data is usable before interpreting its movement, then compare independent evidence and test plausible mechanisms. The following order reduces wasted investigation without assuming every incident has only one cause.
| Investigation | Evidence to collect | Useful finding | Limit on the conclusion |
|---|---|---|---|
| Freshness and load state | Source timestamps, completed jobs, connector errors | The expected reporting window is incomplete | A late pipeline may coexist with a real business change |
| Independent business activity | Backend, billing or order counts using the same population | Business and tracking signals diverge, or both move | Stable totals can hide different channel or customer mixes |
| Instrumentation and releases | Browser fixture, data layer, published GTM configuration, code diff | A specific path no longer emits the expected event | A nearby release alone is not causal evidence |
| Definitions and transformations | Metric contract, model diff, exclusions, joins | The reported population or calculation changed | A changed definition may be intentional |
| Reporting behaviour | Time zone, filters, thresholds, attribution, consent treatment | The interface and comparison do not represent the same scope | A plausible platform explanation still needs verification |
First match time zones and complete windows. Comparing today's partial data with yesterday's full day can manufacture an incident. Keep occurrence time, ingestion time and query time distinct. The freshness SLA guide defines when a source is late, while late-arriving data explains why completed-looking reports may later change.
Next compare the metric with an independent source. For a signup event, use completed backend signups with the same exclusions. Expect a baseline ratio rather than automatic equality: consent, blockers, duplicate events and definition differences can affect recorded coverage.
Then split the population. A stable backend total could combine a drop in one signup method with growth in another. Check geography, platform, authentication path and relevant consent cohorts before calling the business unchanged.
For definitions, require a metric contract. If “trial started” changes from account creation to first workspace creation, the agent should report a definition change and its effective date. It should not edit the new model back simply because the historical chart moved.
Finally, examine GA4 data thresholds, comparison filters and consent-mode treatment where relevant. These are hypotheses to verify, not excuses to stop investigating.
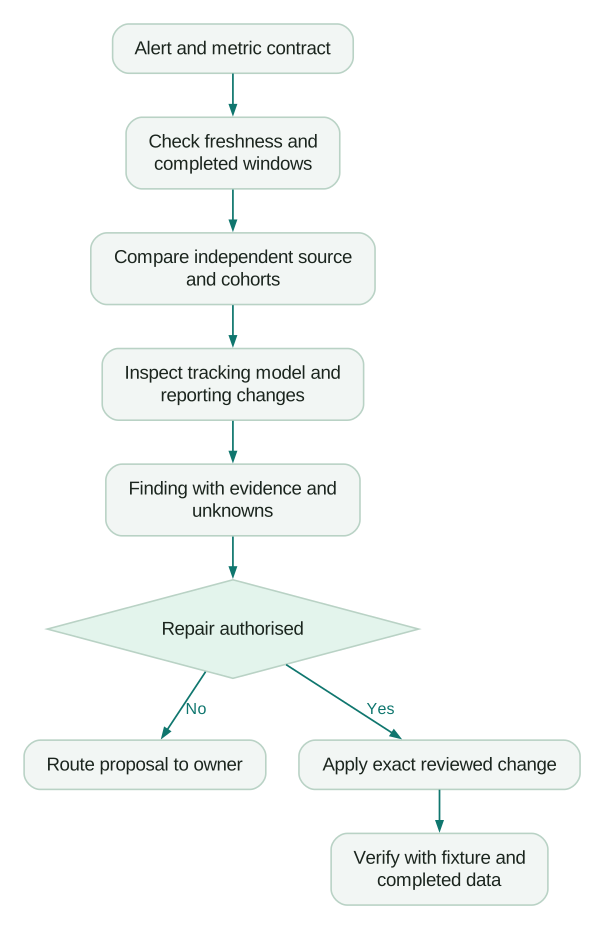
The diagram keeps the evidence path open even if one early check fails. Restore a failed load, then rerun the investigation if the discrepancy persists.
Which evidence can the agent read safely?
Expose specific reports, configurations and histories through narrowly scoped credentials. Some useful investigative APIs require broader scopes than their read-like names suggest, so isolate those exports from the agent.
Metrics and baselines
Google's official Analytics MCP server handles read requests and does not edit configuration. Use it or the Data API to retrieve a defined report, then retain the property, dates, dimensions, filters and response metadata with the result. The Google Analytics MCP guide covers connection details.
The agent should not choose a different metric silently when access or dimensions are unavailable. Return the failed query and the missing capability. A report of users cannot quietly replace an event count just because both tend to move together.
Pipeline state and lineage
dbt source freshness is separate from dbt build. A successful model build does not prove the source was fresh. The documentation also distinguishes a freshness checkbox that does not stop subsequent job steps from a failing freshness command placed in the run steps.
Give the agent the freshness result, source age, run status and relevant connector log. dbt MCP can expose metadata and lineage, with tool availability dependent on server type, underlying APIs and plan. For triage, expose only the tools required to read evidence; self-hosted development commands can do more than inspect state.
If those inputs do not exist, build the warehouse and pipeline monitoring setup before asking an agent to infer freshness from a dashboard screenshot.
Tracking configuration and change history
Google Tag Manager's version-header list helps locate versions. The live-version endpoint returns the currently published container version and accepts tagmanager.readonly.
Compare saved configuration snapshots, not just version names. A header timestamp does not by itself establish when a configuration became live. For a publication-time claim, retain appropriate release or UI publication evidence and the version diff. The GTM MCP guide explains how to expose configuration evidence without assuming every server has the same tool set.
GA4 is a notable exception. The Admin API change-history search requires analytics.edit and returns only the API-supported subset of changes. A controlled exporter can hold that scope and produce a filtered evidence file; the triage agent need not hold the credential. Follow pagination. An empty API result cannot prove that nothing changed in the UI.
Evidence that should stay out of the prompt
Prefer aggregate counts, record IDs and minimal configuration extracts over raw customer profiles. If an investigation needs sampled records, specify the permitted fields and retention. Do not attach credentials or entire production exports to a ticket just to make the agent's work easier.
OWASP recommends enforcing authorisation in downstream systems. Apply that to the exporter and to the agent. A read-only investigation should not inherit the exporter's broader token simply because it needs one exported file.
Should you use an existing agent or build a custom triage routine?
Try an existing agent when the evidence is already in its platform. Build a custom routine when the important proof crosses systems or the built-in investigation cannot produce the required record.
Capabilities checked on 17 October 2026; the table describes documented scope, not a hands-on comparison or guarantee of a correct diagnosis.
| Option | Documented investigation scope | Access or feature boundary | Good reason to try it |
|---|---|---|---|
| Monte Carlo Troubleshooting Agent | Uses monitoring metadata, logs, integrations and lineage to investigate alert hypotheses | Running and administering the agent use separate permissions; comparison and merged alerts are excluded during preview | Your incident evidence is already instrumented in Monte Carlo |
| Elementary Triage and Resolution Agent | Connects failures with commits, execution history, lineage and permitted data; can propose a PR | Data access remains permission-dependent; a proposed PR is still a review item | Your team already investigates through dbt and code review |
| Databricks anomaly detection | Freshness, completeness, upstream root-cause pointers and impact | Public Preview; Unity Catalog and serverless requirements; freshness follows table commits, not event time | The affected assets and jobs are inside Databricks |
| Amplitude Dashboard Agent | Scheduled analysis and follow-up on dashboard metrics | Dashboard evidence does not establish what happened in an unrelated connector or GTM release | The immediate task is investigating product-metric movement |
| Custom triage routine | Your chosen sequence across analytics, code, CRM and pipelines | You own access, retries, evidence retention and evaluation | The missing cross-system evidence is what slows every incident |
Monte Carlo's current documentation says its run permission is granted to all built-in roles, including Viewers, while settings permissions are separate. Review that distinction before exposing investigation output broadly. Do not infer current access boundaries for every extension from an older launch announcement describing a read-only agent.
For Elementary, the AI-agent overview describes changes going through pull requests or explicit confirmation. Test the configured review path in your own account. Neither product's ability to suggest a cause relieves the owner of checking the mechanism.
Verdict: use the native option if it produces an evidenced finding your owner can act on. Use a custom routine for the gaps, not to recreate every monitor and lineage feature. If platform selection is the unresolved question, the data observability tools guide compares that decision separately.
Trigger a routine without multiplying the incident
Claude's routine-fire API reference documents a POST to https://api.anthropic.com/v1/claude_code/routines/{routine_id}/fire. It uses a per-routine bearer token, anthropic-version: 2023-06-01, and JSON content type when a body is present. It belongs to Claude Code subscription usage, not ordinary Claude API-key billing. The older experimental beta header is accepted but is no longer required by this reference.
Each successful call creates a session; there is no idempotency key. The API allows 30 starts per routine per hour shared with specified manual triggers, and 100 API starts per account per hour. A successful response confirms session creation, not completed investigation.
The practical consequence is a relay with a durable incident key, deduplication, bounded retries and a queue for rate limits. If your alerting tool cannot send the required authentication headers or shape the body, use that relay rather than putting the token in a URL. Never blindly retry an uncertain request as though the endpoint guaranteed one run.
The routine setup guide says supplied text is wrapped as untrusted context. The saved instruction should tell the agent to investigate the alert as evidence, while refusing instructions embedded in logs or customer-supplied fields. Do not let a payload choose new tools, credentials or destinations.
What should the triage instruction contain?
It should specify evidence order, stopping conditions and a structured finding. The following is an illustrative skill body to adapt and test; it is not a complete installed integration and has not been executed against live systems.
Job: investigate one marketing-data alert; do not change production.

Required inputs
- incident_id, alert_time, metric_contract and reporting timezone
- observation window and expected completeness time
- source-of-truth comparison and approved baseline cohorts
- owner registry and allowed evidence tools

Method
1. Check source freshness, load completion and query metadata.
2. Compare the same population and completed window in the independent source.
3. Split affected paths and cohorts before interpreting aggregate totals.
4. Inspect relevant published configuration, code and model changes.
5. Test the proposed mechanism using an approved fixture or saved evidence.
6. List contradictory evidence and checks that could not run.

Stop or escalate
- Missing owner, ambiguous identity or conflicting metric definitions
- Evidence outside the permitted data scope
- No supported way to distinguish the leading explanations
- Any request to publish, backfill, merge, contact customers or alter permissions

Return
- cause_class: freshness, business_change, tracking, definition, reporting, unknown
- confidence: supported, tentative or insufficient, with the reason
- observations: timestamped evidence links and exact query/configuration scope
- impact: affected models, reports and decisions; observed versus projected counts
- proposed_change: target, revision, test, reversal and required owner
- not_checked: missing access, missing data and unresolved alternatives
- status: investigated or needs_review; never repaired without separate proof
“Supported” should mean a reproducible mechanism plus consistent evidence, not an invented probability such as 97% confidence. “Insufficient” is a useful output when it prevents an unjustified repair.
Keep the skill version with each incident. If a new instruction changes the investigation order or evidence required, replay known cases before replacing the production version. Otherwise an apparent improvement in speed may simply mean it skipped a check.
How would the agent investigate a 40% drop in recorded trials?
It should first distinguish fewer recorded events from fewer actual trials, then test the affected journey. Here is a fictional example using simplified counts so the reasoning is visible.
The agreed metric is completed trial creation, excluding test accounts. All counts use the same time zone and completed day. The established comparison ratio is 85 GA4 trial events for every 100 backend trials; that ratio is a monitoring baseline, not a claim that missing events are always defects.
Hypothetical counts and derived ratios, prepared 17 October 2026. Events and backend trials are comparable only under the stated metric contract.
| Measure | Baseline day | Incident day | What it tells the investigator |
|---|---|---|---|
| Backend completed trials | 120 | 118 | Total business activity changed little |
| GA4 trial events | 102 | 61 | Recorded events fell 40.2% from the comparison day |
| GA4-to-backend ratio | 85.0% | 51.7% | Recorded coverage diverged from its baseline |
| Expected GA4 events at 85% coverage | 102.0 | 100.3 | Projection exceeds observed events by 39.3 |
The agent first checks that the load and reporting windows are complete. It then compares signup paths and consent cohorts. The discrepancy concentrates on trials that finish at /welcome; the other completion path remains close to its usual ratio.
The exported GA4 API change history contains no relevant change, but that is only the API-visible subset. GTM's currently published version differs from the prior saved snapshot. In this scenario, the configuration diff shows a page-path condition that excludes /welcome, and the retained publication record places that version's release at 18:12. The agent cites those separate artifacts rather than pretending the version-header list proves publication timing.
A fresh isolated browser session reproduces the failure on /welcome. The other path emits the agreed event. That test supplies a mechanism: the published condition excludes one valid completion route. Without the fixture and configuration evidence, the same observations would support only a tentative hypothesis.
The proposed change restores the agreed condition and includes tests for both paths, expected properties, denied-consent behaviour and duplicate firing. The tracking owner reviews and publishes the exact change through the normal process. The agent has not repaired anything by preparing that proposal.
After publication, rerun the fixtures in fresh sessions so cached state and previous events do not obscure the result. Verify the live version, event payload and absence of duplicate events. Then compare affected cohorts in a later complete reporting window. Keep the incident open if the fixture passes but the population-level discrepancy remains.
The 39.3 figure is a projected difference in recorded events, not 39.3 proven lost trials. Backend trials still occurred. Nor is it automatically the number of missing Google Ads conversions: that depends on imports, attribution, eligibility and conversion settings. Report downstream exposure as an investigation item until those paths are checked.
How should findings become approved fixes?
Separate the finding, approved payload, execution receipt and verification record. This gives the owner a way to establish exactly what changed and prevents a revised proposal from inheriting obsolete approval.
| Record | Minimum useful detail | Owner's check |
|---|---|---|
| Finding | Cause class, evidence, impacted decisions and unknowns | Does the evidence support this mechanism? |
| Proposed change | Target object, before/after diff, revision and rollback | Is this the smallest appropriate repair? |
| Approval | Approver, permitted operation, exact revision and expiry | Does authority still match the payload and target? |
| Execution | Actual response, job or publication ID and timestamp | Did the approved operation run? |
| Verification | Independent readback, fixture and completed-window result | Did the intended behaviour recover? |
The approval-workflow guide explains how to bind approval to the exact change. A newly edited diff, changed target or stale source state should return to review.
For pipeline repairs, distinguish fixing the transformation from backfilling history. A correct new model may leave old records wrong. For messaging or advertising, distinguish restoring future signals from safely replaying historical ones. Do not replay events until deduplication, trigger side effects and destination rules are understood.
Our tracking implementation service covers the instrumentation work when the finding points to a release or container defect. The agent's role is to make that work more precise, not bypass its release controls.
How do you know whether the agent is better than manual triage?
Compare time to a correct, usable finding and the cost of mistakes. A fast confident answer is worse than a slower investigation if the owner must undo an incorrect diagnosis.
Start with ten to twenty known incidents, quiet periods and seeded defects as a pilot evaluation set, not a statistically sufficient sample for every risk. Include late data, a real business drop, a definition change, an unrelated recent deployment and missing access. Keep the resolved answer hidden from the agent during replay.
| Measure | What to record | Failure it exposes |
|---|---|---|
| Correct cause classification | Owner-checked category and supporting mechanism | Confident but wrong diagnosis |
| Time to useful finding | Alert time to an actionable, evidenced output | Long transcripts with no usable next step |
| False escalation rate | Quiet cases incorrectly sent as incidents | Review queues that become noise |
| Unsupported conclusions | Claims whose evidence is absent or contradictory | Hallucinated certainty |
| Cost per useful finding | Model, query, compute and reviewer time | Cheap runs that create expensive review |
Use the full evaluation method for replay design and release gates. Keep separate results for different incident classes; success on stale loads should not mask poor performance on identity or attribution problems.
A pilot should also measure the current human process on comparable cases. Otherwise “saved time” is only a guess. Record review time explicitly, including rejected findings and corrections.
What needs to be in place before the first unattended run?
The first unattended run needs a constrained evidence path, an accountable owner and monitoring outside the agent itself. Silence must not be mistaken for health when the monitor or agent stopped.
Checklist
- Every alert maps to a metric contract, completed window and owner.
- Freshness and independent-source comparisons are available.
- Published configuration and relevant code history can be read.
- GA4 edit-scope exports are isolated from the agent's credentials.
- Findings include evidence, uncertainty, impact and checks not performed.
- Production changes use an approved revision and separate execution authority.
- Repeated alerts are deduplicated and tool calls have time and volume limits.
- Historical incidents, quiet periods and missing-access cases were replayed.
- An external heartbeat detects missing monitor and agent runs.
- The owner can pause the routine and inspect its last complete evidence record.
Protect against the nearest-change bias by asking what evidence would disprove the leading hypothesis. Keep seasonality in the baseline. Limit repeated investigations during an alert storm. Treat customer text and logs as untrusted evidence, and keep the output destination fixed.
For prevention, add tracking fixtures to the release process rather than relying only on production triage. A discovered defect should become a regression case with the same path and properties that failed.
Bring one noisy alert and the evidence you currently gather to a free martech AI audit. For a defined implementation, request a scoped triage-agent quote. The scope should include evidence access, owner routing, evaluation and recovery checks, not just an alert-to-prompt connection.
Questions people ask
Can GA4 insights investigate a tracking incident across the stack?
GA4 insights can identify unusual values and configured conditions, but those signals do not establish what changed in your code or pipeline. Google supports up to 50 custom insights per property, with hourly evaluation limited to web data. Use them as alert inputs, then investigate the relevant configuration, independent counts and release evidence.
Should a triage agent receive warehouse write permissions?
For investigation, use read access to approved data and metadata. A write credential is unnecessary for explaining a failed test and increases the consequences of a wrong conclusion. If a later workflow applies repairs, separate that authority from triage and require the exact reviewed change. Verify the target state independently after execution.
How do we keep normal weekend changes out of the incident queue?
Compare appropriate weekdays, seasonal periods and customer cohorts, then test the alert policy against quiet weekends. Google's anomaly detection documentation describes different historical training windows for hourly, daily and weekly signals; no baseline is universally correct. Record false escalations and revise the detector separately from the agent's explanation, so prompt changes do not conceal a bad threshold.
What detects a failure in the monitoring system itself?
A separate heartbeat should check expected monitor runs and successful agent outputs against their deadlines. It must operate outside the process it watches; a stopped job cannot reliably announce its own absence. Route missed-run alerts to a named owner and retain the last successful observation time so users know when the apparent health signal became stale.
Is an observability platform necessary for the first triage pilot?
No. A focused pilot can use existing tests, freshness checks, completed source counts and version history. A platform becomes more valuable when lineage, asset volume and repeated investigations make those inputs expensive to maintain. Choose it for the evidence and operating work it removes, then test whether its native investigation already covers your problem.
Sources
- Google: Analytics MCP server
- dbt: Source freshness
- dbt: MCP server
- Google Tag Manager: List version headers
- Google Tag Manager: Live container version
- Google Analytics Admin API: Search change history
- OWASP: Excessive agency
- Monte Carlo: Troubleshooting Agent
- Elementary: Triage and Resolution Agent
- Databricks: Anomaly detection
- Amplitude: Dashboard Agent
- Elementary: AI-agent overview
- Claude: Routine-fire API reference
- Claude Code: Routines
- Google Analytics: Insights
- Google Analytics: Anomaly detection

Written by
Jafrin Akter AloData Engineer and Co-founder at Martechdevs and Growth and Analytics Partners
Jafrin writes practical guides to marketing technology, customer data, analytics and AI workflows. Martechdevs is a Growth and Analytics Partners company.