
GA4 data thresholds and sampling: why numbers are hidden and what to do
Data Engineer and Co-founder, martechdevs
Last updated 11 min read
GA4 can withhold small populations for privacy, estimate results from a sample, combine less common dimension values into an (other) row or make older event data unavailable after retention expires. These are different limitations. Read the data-quality message first, then choose a remedy that preserves the question you were trying to answer. Changing settings until a number appears can leave you with a different metric and no explanation for the difference.
Last updated: 18 September 2026.
Start with the report's evidence
Open the data-quality indicator and save its message alongside the report. Record the property edition, reporting surface, date range, dimensions, metrics, filters, comparisons and reporting identity. A screenshot of a small number alone cannot distinguish a collection problem from a reporting limit.
Make a copy of the report before simplifying it. Remove one condition at a time and record what changes. If removing Age makes a warning disappear, that gives you a different lead from a warning that disappears only when you shorten a 12-month date range.
Use this diagnostic order:
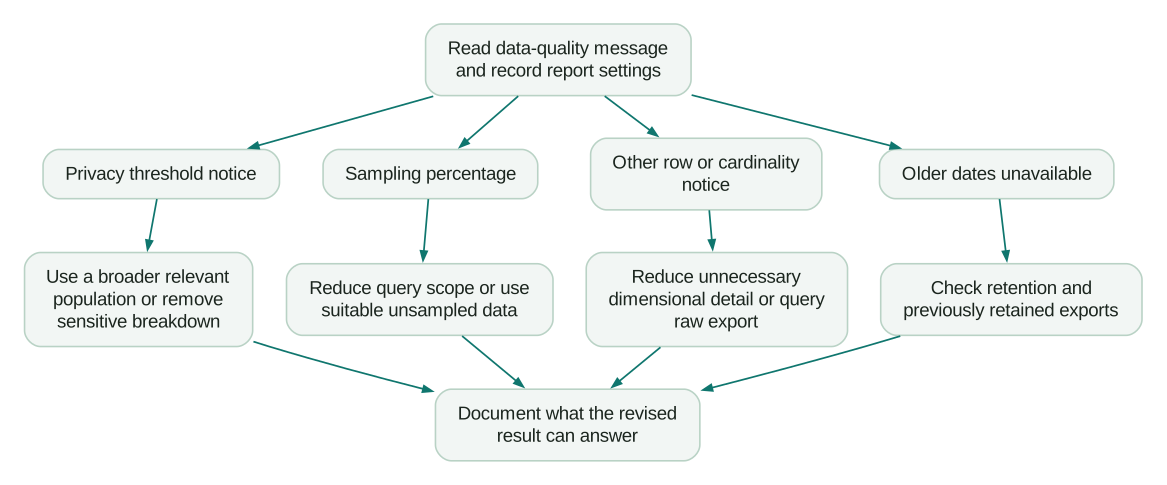
If the report instead contains (not set), investigate whether the selected dimension was collected on the relevant events. The GA4 missing-dimension guide follows that path. A missing parameter is not repaired by increasing a sampling limit.
Privacy thresholds withhold information about small populations
Google applies system-defined thresholds to reduce the risk of identifying individual people from sensitive combinations of data. Its documentation identifies demographic data, audiences defined using demographics and low-volume search-query information as affected cases. The threshold cannot be set to an arbitrary number by an administrator. Google's threshold guidance describes the warning and suggests broadening a narrow date range where appropriate.
A withheld row is not evidence of zero activity. If a small age-and-interest segment disappears, do not calculate its conversion rate as zero or conclude that the audience never buys.
First ask whether that breakdown is necessary. A growth team deciding which landing page to fix may be able to use page, device and a relevant acquisition cohort without adding demographic fields. Remove detail that does not change the decision, then check the indicator again.
A longer period can help only if the resulting population still answers the question. Combining six months to investigate a campaign launched last week changes the scope. The broader result may be useful for long-term planning, but it cannot stand in for the new campaign's performance.
When a small population remains unavailable, record that limitation. Do not present a made-up estimate as an observed result. For a high-value but tiny customer segment, consented qualitative research and first-party business records may answer the product question more directly than a demographic analytics slice.
Google signals and reporting identity are separate controls
Do not follow an old checklist that says every threshold is fixed by disabling Google signals. Google's current reporting-identity documentation lists User-ID, device ID and modelling. Blended uses those spaces in that order; Observed uses User-ID and device ID; Device based uses only device ID. Google signals is not listed as an identity space in that current definition. See the current reporting options.
A change to reporting identity can change the result because it changes how activity is associated with users. Google says the choice does not permanently alter collected or processed data. That makes a documented comparison possible, but does not make the resulting counts interchangeable. The same documentation also describes thresholds around reporting with signed-in identities.
Before comparing identities, save the original setting and report. Change only that variable, if you have authority to change the property's reporting configuration, and label both outputs. Restore the agreed setting afterwards. Explain whether the business wants a device-oriented measurement or a user journey that can connect authenticated activity.
Do not recommend switching off a collection or advertising feature as a universal troubleshooting shortcut. Establish which feature and report combination produced the warning, then consider the consequences for the other teams using the property.
Sampling estimates a result from part of the event data
Sampling can occur when the events needed for a query exceed the property's limit. The data-quality indicator reports the percentage used. Google's current event-level query limit is 10 million events for standard properties. Analytics 360 starts at 100 million per query by default and can use up to 1 billion through the more-detailed-results option in Explore. These limits concern events queried, not the number of rows displayed. Google's sampling documentation explains the distinction.
A report with five visible rows can still involve a large event population. Equally, a site with modest traffic may have many events per visit. Check the indicator rather than estimating the risk from page views alone.
For an initial diagnosis, shorten the date range while keeping the business definition stable. If you only need the last completed month to choose the next experiment, querying two years creates unnecessary work and may introduce sampling. Remove irrelevant dimensions and segments too, but verify the result; a simpler-looking report is not a guarantee of an unsampled query.
If the original question requires a full-year user journey, splitting it into months can break the analysis. Funnel membership, sequences and retention windows may cross the split. Decide whether the analysis is genuinely separable before combining smaller queries.
Do not add monthly unique users
Consider an illustrative exact dataset with 10,000 users in January and 8,000 in February. Four thousand appear in both months. The two-month population is 10,000 + 8,000 − 4,000 = 14,000 users. Adding the monthly totals produces 18,000 and counts the overlap twice.
The same issue affects distinct accounts and people completing a journey. Breaking a query into smaller date ranges is safe only when the aggregation method preserves the required identity and time logic.
Rates need their denominators too. If one disjoint period has 100 qualifying sessions out of 1,000 and another has 100 out of 5,000, the combined rate is 200 ÷ 6,000 = 3.33%. Averaging 10% and 2% gives 6%, which is wrong for the combined population. This is ordinary aggregation arithmetic; it does not reverse-engineer GA4's sampling method.
Unsampled does not mean every count is mathematically exact
Google uses HyperLogLog++ approximation for commonly used distinct counts, including users and sessions, even in unsampled reporting. The sampling reference notes this separately. A 100% sampling indicator therefore does not imply equality with every exact SQL count.
For small differences, first align the identity, session definition, time zone and included events. For a rare outcome that drives a consequential decision, inspect suitable retained event data and report uncertainty. A high overall sample percentage alone does not tell you how reliable a tiny filtered segment is.
The `(other)` row means detail was condensed
GA4 can group less common dimension values when the underlying table exceeds its row limit. More dimensions and more unique values increase the number of possible combinations. Google calls more than 500 values a high-cardinality warning sign, not a hard collection cap, and says row limits vary by report, property and query complexity. Its (other) documentation explains why the warning can matter even when a filter hides the row itself.
Inspect what makes the dimension large. For a SaaS product, candidates include full URLs containing request IDs, a custom dimension containing a distinct workspace ID or a timestamp stored as a reporting category. These fields may be useful in raw investigation but poor choices for routine chart breakdowns.
Separate a readable analytical category from operational detail. For example, use an agreed page type such as pricing, documentation or application report for a content comparison, while retaining an appropriate raw reference for a different investigation. Keep the meaning explicit: a grouped page type cannot answer which individual document failed.
Do not remove campaign parameters from collection merely because URLs look untidy. Design URL handling and reporting dimensions so acquisition information survives while irrelevant variants do not dominate a business report. Put that rule in the event and naming convention.
If every individual value is necessary, move the analysis to an appropriate raw-data model. Removing detail to make a chart load is useful only when that detail is irrelevant to the decision.
Retention controls how much event history remains available
Standard GA4 offers 2- or 14-month retention for the relevant user and event data. The setting affects explorations and funnel reports, while standard aggregated reports are outside that event-retention control. Longer settings have edition and property-size qualifications; demographic data also has separate limits. Increasing retention applies to already collected data that still exists, but cannot restore data already deleted. Google's retention policy is the reference for the exact scope.
If older Explore dates are unavailable, check the retention setting and when it changed. Also establish when the property started collecting the required event. Neither a longer window nor an upgraded plan can make an event exist before it was implemented.
Do not read “aggregated reports are unaffected” as a promise that every field remains available indefinitely. Google separately documents a rolling 36-month limit for Google Ads data in Analytics, with specific presentation rules. The same retention documentation covers that separate boundary.
Set retention to match a real analytical need and your organisation's data policies. For annual comparisons of granular journeys, plan the retained dataset before the comparison is due. Record the earliest usable date for each event definition, including changes that make old and new values incomparable.
Processing delays can resemble missing data
Today's values may still be changing. Google says processing can take 24–48 hours and that Reports and Explore may not be synchronized. Its freshness documentation describes the processing intervals.
Check a completed earlier period before investigating an apparent collapse in the latest hours. If earlier data is healthy and only current data is incomplete, record the observation time and check again after the relevant processing window. If a known event fails in a controlled collection test, fix that evidence now rather than waiting for a reporting delay to solve an implementation fault.
This distinction matters during a release. A clean DebugView test shows the test event reached a diagnostic surface. It is not proof that every processed report, advertising integration and warehouse table is already complete.
When BigQuery is the useful next step
Use BigQuery when the decision needs retained event detail, explicit joins, high-cardinality investigation or calculations you can define and review in SQL. The GA4 export guide covers the setup and modelling work.
The export is a different dataset from the interface. Google describes it as raw event and user-level data without the reporting value additions. Standard daily export is limited to 1 million events per day; streaming is best-effort and can contain gaps. Google signals data is not exported. Those boundaries mean BigQuery is not a way to recover every withheld demographic row or reproduce every modelled report. See export behaviour and threshold-related export limits.
Before choosing it, answer four operational questions:
- Does the required date range actually exist in your export?
- Are the necessary events, identifiers and parameters present?
- Who owns the metric definition, query review and reconciliation?
- Who monitors export failures and query cost, access and retention?
A useful warehouse report states its unit of analysis and identity rules. For example, “distinct authenticated application user IDs with a successful export during the month” is reproducible. “Users, matched to GA4” is not a definition.
If reporting restrictions repeatedly prevent a high-value decision, compare the cost of a maintained warehouse model with the relevant 360 capability. An upgrade should resolve an observed requirement. Buying a higher event limit will not repair missing tags, restore deleted history or make privacy thresholds disappear universally.
Keep a decision record for the chosen remedy
Before accepting the revised report, complete these checks:
Checklist
- The original warning and report configuration are saved.
- Privacy suppression, sampling, cardinality, retention and collection failures have been considered separately.
- Any changed date range or dimension still answers the business question.
- Split-period calculations preserve overlaps, denominators and journey windows.
- A reporting-identity comparison is labelled and the agreed property setting is recorded.
- A warehouse result names its source dates, identity rules and known differences from GA4.
- The conclusion states what remains unknown.
For a product launch, that conclusion might be: “We can compare completed sign-ups by landing page for the launch period. The demographic breakdown is unavailable at this scale, so we will not use it to choose the next campaign.” That is a usable decision with a clear boundary.
An analytics and tracking review is useful when nobody can tell whether the limitation comes from collection, configuration or the reporting surface. Ask for a reproducible diagnosis and a maintained reporting definition, with any remaining gaps made visible.
Questions people ask
Can I turn off GA4 data thresholds?
You cannot choose the privacy threshold yourself. Test whether a broader relevant population or a less sensitive breakdown answers the question. Keep withheld information labelled as unavailable, and do not treat a different report as a recovery of the original missing detail.
Does standard GA4 sample only in Explore?
No. Google's sampling guidance covers reports, explorations and requests when the underlying query exceeds relevant limits. Read the data-quality indicator for the actual result instead of relying on the name of the reporting surface.
Will switching to Device based make all reports accurate?
It changes the identity used in reporting. That can be useful for a labelled comparison, but a device-oriented count may not answer a question about people using several devices. Establish the intended unit before deciding which output is appropriate.
Does 14-month retention mean I immediately get 14 months of history?
Only history that was collected and still retained can be available. Check the existing dataset and the event's implementation date. A settings change cannot reconstruct deleted records or events that were never collected.
Should every small SaaS business set up BigQuery?
Evaluate the expected use. Early export can preserve useful analytical options, but someone must maintain access, cost controls, data retention and definitions. If the team cannot name a decision requiring event-level history or joins, start by documenting that need before building a large reporting stack.
Sources
Written by
Jafrin Akter AloData Engineer and Co-founder, martechdevs
Jafrin Akter Alo is a data engineer and co-founder of martechdevs, where the team has delivered 74+ martech, data and growth stack implementations.