
Why is GA4 so hard to use? Diagnose the problem before changing the setup
Data Engineer and Co-founder, martechdevs
Last updated 11 min read
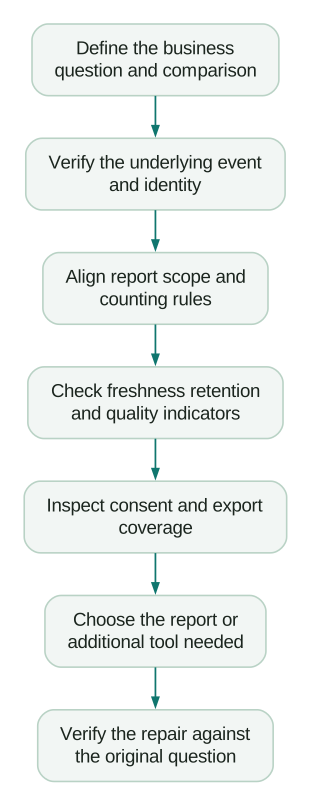
GA4 becomes difficult when a business question, an implementation problem and a reporting rule are treated as the same issue. A missing purchase needs a different fix from an expired exploration history or two reports using different traffic-source scopes. Start with one decision and one reproducible discrepancy. Check the event, identity, reporting definition and data availability in that order, then choose the reporting surface that can answer the question.
Last updated: 5 October 2026.
Turn “GA4 is wrong” into a question you can investigate
“Why did paid traffic fall?” is incomplete. Paid sessions, first-time users acquired through paid channels and conversion credit assigned to paid interactions are different measures. Before touching a tag, write the report name, exact dimension, metric, date range, timezone and filters.
Then state what you expected and why. A checkout database can support an expected order count. A colleague remembering that last month's dashboard looked higher is a reason to inspect the report, not yet evidence of missing collection.
Use this diagnostic record. The values below illustrate a question; they are not findings from a customer account.
question: "Are successful demo requests reaching our analytics property?"
business_outcome: "Application confirms one accepted demo request"
counting_unit: "Distinct request ID"
comparison_period: "A completed week in the property timezone"
expected_evidence: "Eligible accepted requests from the application"
analytics_evidence: "Matching request events and permitted identifiers"
segments_to_check:
  - "Desktop versus mobile"
  - "Embedded form versus native form"
  - "Approved consent states"
owner: "Marketing operations with the application engineer"
acceptance_condition: "Each unexplained difference has a verified cause"
The record keeps the team focused on a repairable question. If the form submits successfully but the analytics event never leaves the page, investigate collection. If the event exists and is grouped under an unexpected channel, investigate source data and classification. Do not fix both by changing a dashboard filter.
First, stop comparing different definitions
Google's acquisition-report comparison distinguishes user-scoped acquisition from session-scoped acquisition. A person can first discover your website through organic search and return later through an email campaign. A first-user view can retain organic search while the return session belongs to email.
That is a useful distinction when the question is clear. It becomes frustrating when two people use those reports as competing answers to “Which channel worked?”
For an illustrative journey, a founder reads your guide after an organic search on Monday, returns through a newsletter on Thursday and requests a demo. The first discovery, Thursday's visit and the credit assigned to the demo are three separate reporting questions. Pick the question before picking the dimension.
Create a short definition beside recurring dashboards: what is counted, which source scope is used and which period is included. Keep those definitions consistent when exporting to a spreadsheet or changing the report layout.
Also inspect whether the metric concerns all configured key events or one selected business outcome. A report combining newsletter signups and paid subscriptions cannot tell you the paid-subscription conversion rate merely because its column says “key events.” The key-events guide explains how outcome selection, counting and advertising goals interact.
Fix purchase identity before arguing about revenue totals
An ecommerce implementation needs a stable transaction identifier that represents the actual transaction. A thank-you-page reload should not become another order, and two different orders should not share a constant placeholder ID.
Google documents purchase deduplication by transaction ID for web streams. An empty transaction_id is especially dangerous because purchases carrying that empty value can be deduplicated together. The documented transaction-ID deduplication behaviour does not apply to app streams. Google's transaction-ID guidance.
Inspect actual values in a small set of events. Do not stop at seeing that a field named transaction_id exists. Check successful purchases, failed payments, refreshed confirmation pages, repeat customers and the checkout paths your customers use.
Next align the commercial definition. “All orders created” can include records that your business would not count as completed paid orders. Refunds, tax, shipping, currency, test transactions and timezone boundaries can explain differences before any collection defect is involved.
Use an order-level join to separate missing IDs, repeated occurrences and value mismatches. A total that happens to match can hide errors that cancel one another. The Shopify and GA4 reconciliation guide provides the detailed process and an example dataset.
Do not declare GA4 accurate or inaccurate for every purpose based on one revenue comparison. Establish which outcomes are observable, which are excluded by the approved implementation and which remain unexplained.
Investigate payment referrals as a journey problem
A payment provider appearing as an acquisition source can mean the return from checkout is being treated as a referral. Google supports unwanted-referral conditions for cases such as third-party payment processors. The matching referrer is ignored as a traffic source.
Apply that setting only after tracing the route. It should represent a domain that is part of completing the customer's existing journey, not a source you dislike seeing in a report.
If the journey crosses domains you operate and can tag, inspect cross-domain measurement. Confirm the intended web stream and identity handoff, including whether redirects preserve the linker parameter. That is different from suppressing a payment provider's referral label.
Work through one transaction from its original landing page to the final success state. Inspect the initial source, navigation to the next domain, consent behaviour and return event. Hiding an unwanted label cannot reconstruct an identifier or campaign value that the implementation failed to preserve.
After the repair, repeat the same route with known source information. Record the effective change date so a historical report is not mistaken for evidence that the new configuration failed.
Treat `(not set)`, Unassigned and `(other)` separately
These labels are not synonyms for missing purchases.
(not set) means the selected dimension lacks the information needed for a value. The investigation depends on the dimension: a missing landing page, an unmapped Google Ads field and an absent custom parameter have different causes. Follow Google's dimension-specific explanation, then use the GA4 (not set) diagnostic guide for the relevant branch.
Unassigned means the traffic did not match another channel rule. Inspect the underlying source, medium and relevant platform fields before relabelling the row. Google's default channel definitions are the reference for that classification. A custom grouping can implement your reporting taxonomy; it does not recover information that was never collected.
(other) can appear when less common dimension combinations are condensed because the underlying table exceeds its row limit. Google's cardinality explanation describes this behaviour. Avoid registering a distinct order number or other nearly unique value as a general reporting dimension simply because it is available.
These distinctions change the repair. A broken event parameter needs collection work. A valid marketing source outside your chosen channel rules needs taxonomy work. Too many dimension combinations need a more suitable report or analysis method.
Check whether the report is ready and allowed to show the data
Three more mechanisms can change what you see without sharing the same cause.
Processing time
Google says data processing can take 24–48 hours, and some attribution credit can continue changing afterwards. Realtime and completed daily reporting serve different purposes. Use Google's freshness guidance to choose an appropriate comparison period.
A missing event in a controlled collection test needs attention immediately. A difference in a current-day channel report may need processing time before you can assess it. Write down which situation you are investigating instead of waiting two days for every defect or treating every live report as final.
Privacy thresholds
GA4 can withhold small groups in reports involving sensitive signals such as demographic data or search queries. The data-quality indicator identifies thresholding. Google's threshold guidance explains when broadening the date range may make a result available.
A withheld row is not proof that no event occurred. Avoid changing identity settings merely to make a chart look complete without understanding how the report's meaning changes. The thresholds guide separates these cases in detail.
Sampling
Some queries analyse a sample when they exceed the applicable limits. Google displays the proportion used in the data-quality indicator. Sampling documentation explains that this is distinct from privacy thresholding and cardinality.
Save the quality indicator with any discrepancy investigation. “Both screenshots cover last month” is insufficient if one query is sampled, another uses different dimensions and neither has the same filters.
Preserve the history you need before it expires
Check the property's retention setting against the analyses your team intends to run. Standard properties support two- and 14-month user/event retention options, subject to Google's documented limits. Where your data policy permits and the business needs it, select enough history for the planned exploration.
The setting affects explorations and funnel reports; it does not shorten standard aggregated reports in the same way. Increasing retention can preserve already-collected data that has not been deleted, but it does not restore data already removed. Google's retention documentation also describes automatic reductions for sufficiently large properties.
This explains a common-looking contradiction: a standard report still shows last year's aggregate, while an exploration cannot recreate the desired detailed cohort. The existence of the aggregate does not establish that the underlying detail remains available for every new query.
Write the required history into the measurement plan. A quarterly team that wants a year-over-year activation analysis should not discover the retention boundary on the morning of the review.
Verify consent behaviour without treating modelling as a repair button
A banner can be visible while its signals arrive late, reach only some pages or fail to reflect a preference change. Test the approved default and update behaviour through the actual journey. Do not change denied states to granted because you want a higher event count.
Behavioural modelling has separate eligibility requirements. Google's current modelling documentation requires the advanced web implementation and sufficient observed and denied-consent data. Its published thresholds include at least 1,000 denied-consent events daily for seven days and 1,000 daily consented users on at least seven of the previous 28 days. Meeting those external thresholds still does not guarantee eligibility.
A low-volume property may therefore have a correctly implemented consent flow without receiving modelled behavioural data. Do not describe that as a broken banner or promise that a configuration change will reconstruct every missing user's journey.
Use the reporting identity and data-quality information to understand whether estimated data is included. Keep observed records and modelled reporting distinct when comparing them with operational systems.
The collection policy comes first. Modelling availability is a property capability to understand, not a reason to weaken the organisation's approved consent behaviour.
Treat BigQuery export as a data pipeline
BigQuery is useful when you need event-level investigation, joins to your own business records or reusable reporting definitions. Exporting does not automatically fix an incorrect event or turn raw data into a finished decision tool.
Google's export documentation distinguishes the raw export from the processed interface. It also describes streaming as a best-effort service that can contain gaps. The standard property's daily export limit is one million events; daily and streaming are different export modes.
Check the selected streams, event exclusions, dates present, table freshness and billing or access failures. Google's export setup guide warns that consistently exceeding the daily limit can pause exports and that missed days are not reprocessed. It also documents failures involving billing, service accounts and project policies.
A link showing as configured is not an operating check. Assign an owner to missing daily tables and abnormal event volumes. Record expected exclusions so someone does not spend a morning investigating a deliberately omitted event.
When comparing the warehouse with GA4, align definitions and account for the interface's processing. Do not expect a raw SQL count to reproduce every modelled or attributed metric automatically. The GA4 BigQuery export guide explains how to build and maintain that comparison.
Decide what belongs beside GA4
Choose another tool because it makes a recurring decision easier, not because the current report is irritating.
Keep a GA4 report when it answers the acquisition or website-performance question with definitions the team understands. Simplify its dimensions and save a consistent view instead of rebuilding it every week.
Evaluate a product-analytics workflow when product and growth teams repeatedly need behavioural funnels, retention cohorts and segmentation around product use. Test a real question such as “Which new accounts complete the setup that predicts later value?” Include identity and account relationships in that trial. A different interface cannot rescue unreliable events.
Use a warehouse model when the question depends on joining product behaviour to billing, CRM or support records, or when several teams need one reusable metric definition. Budget for maintaining that model and presenting its result to the person who makes the decision.
These choices can coexist. The product-analytics setup guide helps define the questions, events and acceptance tests before adding Mixpanel, PostHog or another product. Do not run two copies of vague measurement and expect clarity from the extra subscription.
Prioritise the repair by business consequence
Start with errors that can corrupt a decision or create irreversible gaps: false success events, missing transaction identity, incorrect values, broken consent behaviour and stopped exports. Then fix source continuity, retention requirements and recurring reporting definitions. Polish dashboards after those foundations are understood.
Close an issue only when the original question has a verified answer. A useful handover names the cause, the change, the affected date range and the remaining limitation. “Updated GTM” does not tell the marketing manager whether last month's report is trustworthy.
Checklist
- The question specifies outcome, counting unit, period and reporting scope.
- Representative successful and failed journeys produce the expected events.
- Transaction or request identity survives refreshes and retries appropriately.
- Traffic-source differences are explained before changing classification.
- Quality indicators, processing time and retention are checked.
- Consent behaviour and modelling eligibility are assessed separately.
- Export completeness has an operating check and an owner.
- The team can repeat the analysis and knows its limits.
An analytics and tracking audit should leave you with that evidence and a prioritised repair plan. The point is to make the next product or marketing decision more reliable, not to force every number in every interface to look identical.
Questions people ask
Is GA4 inaccurate?
Its usefulness depends on the implementation and the question. Missing events and incorrect values are defects; different scopes, processing, privacy controls or modelling can also create legitimate differences. Investigate a defined comparison before making a blanket judgement.
Why do User acquisition and Traffic acquisition disagree?
They organise data around different scopes. A person's first discovery channel can differ from the source of a later session. Select the report that matches your acquisition or re-engagement question.
Will changing retention to 14 months restore old explorations?
It can preserve eligible data that has not already been deleted. It cannot recreate removed detail. Check the property's applicable retention limits and the dates actually available before promising a historical analysis.
Why is behavioural modelling unavailable after installing a banner?
Modelling requires a compatible implementation, sufficient data and model eligibility. A banner alone does not satisfy those conditions. Verify consent behaviour first and assess modelling separately.
Should I replace GA4 with product analytics?
Test the recurring question you need to answer. Product analytics may make product funnels or retention work easier, while GA4 remains useful for other acquisition questions. Repair shared event and identity problems before expecting another tool to solve them.
Sources
- Google: Acquisition report scopes
- Google: Transaction-ID deduplication
- Google: Unwanted referrals
- Google: Cross-domain measurement
- Google: Meaning of
(not set) - Google: Default channel groups
- Google: The
(other)row - Google: Data freshness
- Google: Privacy thresholds
- Google: Sampling
- Google: Data retention
- Google: Behavioural modelling
- Google: BigQuery Export
- Google: Export setup and failures
Written by
Jafrin Akter AloData Engineer and Co-founder, martechdevs
Jafrin Akter Alo is a data engineer and co-founder of martechdevs, where the team has delivered 74+ martech, data and growth stack implementations.
