
Data Warehouse ROI: Build a Three-Year Business Case You Can Defend
Data Engineer and Co-founder, martechdevs
Last updated 12 min read
A data warehouse pays back when it removes measurable work or spending, enables decisions people actually use, and costs less to build and operate than the value it creates. Calculate cash savings separately from staff capacity. A project can be operationally valuable while still requiring cash throughout the first three years.
Last updated: 14 September 2026.
For a small company, the case usually starts with a recurring problem: someone joins billing, CRM and product exports every week; teams disagree about customer status; or a useful audience cannot be built without manual work. The investment should solve a defined version of that problem, with an owner and a way to measure the result.
This guide builds an illustrative model for a 20-person company. Every commercial input is an assumption, not a market average, vendor quote or promise of savings. The example deliberately shows both a positive capacity-inclusive case and a negative cash-only case.
Measure the current process before valuing the replacement
Choose a few recurring workflows and record their actual burden. Include preparation, reconciliation, correction, review and recovery from failures. Sample normal periods and at least one reporting close or campaign launch; an unusually quiet week is a weak baseline.
For each workflow, record its frequency, people involved, time per run, external invoices, software used and output. Then identify which part the proposed warehouse will remove. Some work will remain because someone still needs to define metrics, investigate exceptions and make decisions.
Anaconda's 2020 survey reported an average 45% of respondents' time on loading and cleansing data. That is a dated survey finding about data work, not evidence that your marketing team will recover 45% of its hours after buying a warehouse. Use it as a reason to investigate preparation work, not as an input to your financial model. Anaconda's 2020 report
A useful baseline might say: “The weekly revenue reconciliation takes four hours, and the monthly close adds another six. The proposed model should remove the repeated joins while preserving a one-hour exception review.” That statement can be tested after rollout.
If your problem is still unclear, the warehouse decision guide helps determine whether a warehouse is the appropriate next investment.
Separate three kinds of benefit
Cash spending that actually disappears
Examples include a tool you can cancel, a contractor invoice that will shrink or a documented service charge you will no longer incur. Record the contract owner, cancellation date and amount that stops being paid.
A license with nine months remaining does not create immediate cash savings merely because the team stops using it. A fixed contractor retainer does not shrink automatically when a reporting task becomes faster. Model the actual commercial change.
Capacity returned to existing staff
Internal hours saved can be valuable even when payroll does not change. Multiply hours genuinely removed by a defensible internal cost rate, then specify what that capacity will be used for.
Keep the gross time estimate separate from the realization assumption. If a workflow removes 40 hours of effort but only 30 can reasonably be redirected to useful work, value 30 in the base case. Fragmented five-minute savings scattered across many people may be harder to use than a full day returned to one analyst.
Do not count the same hours as both lower contractor spending and internal capacity. Identify the people and work packages behind each benefit.
Additional business outcomes
A joined customer model may support better lifecycle campaigns, faster sales preparation or useful AI analysis. Those are capabilities until you show how they change an outcome.
For revenue-related benefits, value incremental contribution after relevant variable costs, rather than all revenue attributed to a new audience. Include the extra campaign, sales and support work required. A refreshed dashboard is not itself a revenue event.
Keep unproven upside outside the committed base case. Give each potential benefit an owner, a test and a date for deciding whether to include it. This lets the business recognize strategic value without disguising a guess as a saving.
Cost the complete operating system
The warehouse bill is one line in the model. Include initial discovery, metric definitions, ingestion, historical loading, identity mapping, transformations, quality checks, reporting, access controls, documentation, migration and training.
For recurring costs, include compute, storage, connectors, orchestration, monitoring, reporting tools, support and maintenance. Account for source schema changes, failed loads, changed business definitions and the person who responds when the system breaks.
Use current workload estimates and billing terms. BigQuery distinguishes analysis pricing from storage and other services. Snowflake's compute documentation distinguishes warehouse compute from serverless and other compute categories. A small query estimate does not price the complete stack. BigQuery pricing, Snowflake compute costs
Model migration overlap explicitly: old tools and processes may remain while you reconcile the replacement. Include the cost of retiring them, not just implementing the new system. If an existing employee operates the warehouse, show that person's capacity cost even when it is not incremental cash spending.
The marketing warehouse architecture guide explains the components that need to be owned. For pricing detail, use the BigQuery cost guide or Snowflake cost guide with your actual workload.
Use vendor studies for questions, not your forecast
Sponsored ROI studies can reveal useful benefit categories and modeling conventions. Their headline returns do not establish the economics of a different company, baseline or implementation.
IDC's September 2023 Fivetran study was sponsored by Fivetran and based on interviews with seven organizations. The participating organizations ranged from 35 to 8,000 employees, averaging 2,684. Its analysis includes productivity, operational savings, implementation investment and discounted three-year value. That is useful structure; it is not a predicted return for a 20-person team. IDC's Fivetran study
dbt's summary of its commissioned Forrester study describes interviews with four organizations and a composite with $2 billion in revenue, 5,000 employees, 25 data engineers and 200 analysts. Copying the composite's return or payback period into a small-company proposal would obscure the assumptions that make those results possible. dbt's Forrester study summary
Borrow the discipline: list costs, identify benefit owners, include deployment time, discount future value and test uncertainty. Replace the inputs with your own evidence.
A worked example for a 20-person company
Assume a company wants one reliable account model joining CRM, billing and product activity. The first release serves revenue reconciliation and a small set of lifecycle audiences. It does not attempt to replace every analytics tool.
The illustrative implementation costs $18,000 at month zero, covering the agreed design, build, migration and handover. Ongoing monthly cash spending begins in month one:
- Warehouse storage and compute allowance: $350.
- Ingestion allowance: $200.
- Orchestration and monitoring allowance: $150.
- Contracted maintenance: 12 hours at $75, or $900.
Total recurring cost is $1,600 per month. These are planning allocations, not a priced vendor configuration. The maintenance is explicitly contracted in this example, so the model treats it as cash spending.
Benefits begin at the end of month four, after implementation, reconciliation and adoption:
- Retired software removes $600 of monthly payments.
- A separate reporting contractor's invoice falls by $1,200 per month.
- Existing staff recover 30 usable hours per month, valued at an assumed $60 per hour: $1,800 of capacity.
The contractor saving and internal hours cover different work. The internal staff remain employed at the same pay. The $1,800 capacity value therefore does not enter the cash-savings column.
No revenue uplift, avoided incident or AI productivity benefit is included. Taxes, inflation, financing and terminal value are excluded for this simplified planning example. Use a consistent finance-approved treatment for those items in a real proposal.
Calculate ROI, payback and discounted value separately
Over 36 months, total undiscounted cost is $18,000 plus 36 times $1,600: $75,600.
There are 33 benefit-bearing months, from month four through month 36. Cash benefits are 33 times $1,800, or $59,400. Including the separately valued internal capacity doubles modeled benefits to $118,800.
The three-year results are:
- Cash-only net benefit: $59,400 minus $75,600 = negative $16,200, an undiscounted ROI of negative 21.4%.
- Capacity-inclusive net value: $118,800 minus $75,600 = $43,200, an undiscounted modeled ROI of 57.1%.
Here ROI means net benefit divided by total cost on the stated basis. Some studies use discounted benefits and costs for their ROI percentage. Do not compare percentages without checking the denominator and timing convention.
Payback must include the rollout delay
By the end of month three, the project has consumed $18,000 plus $4,800 in recurring costs: $22,800.
From month four, the capacity-inclusive net value is $3,600 minus $1,600, or $2,000 per month. Cumulative modeled value first becomes nonnegative in month 15. At the end of month 14 it is still negative $800; at the end of month 15 it is positive $1,200.
The cash-only stream produces just $200 net per month after benefits start, so it does not pay back within the three-year horizon. Calling month 15 a cash payback would be wrong.
Discount future months consistently
For illustration, use a 10% effective annual discount rate. This is an assumption for the example, not a recommended rate for your company. Its equivalent monthly rate is (1.10)^(1/12) - 1, approximately 0.7974%.
Discount each end-of-month net amount by its month number and include the initial $18,000 outflow at time zero. The resulting three-year values are approximately negative $17,078 cash NPV and $33,743 capacity-inclusive value NPV.
The latter includes monetized staff capacity and must be labeled accordingly. Discounting does not turn that capacity into cash. On the same assumptions, discounted capacity-inclusive payback first occurs in month 16.
Microsoft's NPV documentation treats the supplied future amounts as equally spaced end-of-period flows and adds a time-zero investment separately. That convention matters: placing the initial investment inside the future-flow range shifts it by a period. Excel NPV documentation
Recreate the model in a spreadsheet
Create columns A through H for month, cost, cash benefit, capacity value, net cash, net value, cumulative cash and cumulative value.
Use rows 2 through 38 for months zero through 36. Enter $18,000 in B2 and $1,600 in B3:B38. Set C2:C5 and D2:D5 to zero. Enter $1,800 in C6:C38 and D6:D38, so benefits begin in month four. Keep costs as positive inputs in column B.
Put the annual discount rate, 10%, in J2. Use these formulas, filling E2:H2 down through row 38:
E2 = C2-B2
F2 = C2+D2-B2
G2 = SUM($E$2:E2)
H2 = SUM($F$2:F2)

Monthly discount rate in J3:
=(1+J2)^(1/12)-1

Cash NPV:
=E2+NPV(J3,E3:E38)

Capacity-inclusive value NPV:
=F2+NPV(J3,F3:F38)
The first month whose cumulative column is nonnegative is that stream's undiscounted payback month. If none crosses zero, report that payback is outside the modeled horizon; do not return zero months or hide the result.
For irregular payment dates, use a dated cash-flow model rather than forcing everything into equal monthly intervals. Maintain the same timing basis across costs and benefits.
Test the assumptions that could reverse the decision
The strongest sensitivity check changes a disputed operating assumption, not just the discount rate.
If only 15 of the 30 monthly staff hours become usable capacity, the monthly capacity value falls to $900. Keeping everything else unchanged, three-year modeled net value becomes $13,500, value NPV approximately $8,333, and undiscounted payback moves to month 24.
If the full benefits instead start in month seven, with operating costs continuing from month one, modeled net value becomes $32,400, value NPV approximately $23,363, and undiscounted payback moves to month 20.
If finance accepts only cash savings, the earlier negative cash-only case applies. That does not mean the warehouse has no value. It means the decision needs to justify the additional investment in capacity or capability rather than claim it funds itself within three years.
Also test implementation overruns, higher maintenance needs and contract renewal dates. Keep scenarios coherent. Do not combine a fast rollout, maximum adoption, immediate cancellations and minimal maintenance merely because each is individually possible.
Connect each benefit to an acceptance test
Tie benefit release to operational evidence. A retired tool requires cancellation and an agreed replacement. A reduced reporting invoice requires a changed scope or bill. Recovered staff time requires the workflow to work and the team to use it.
For the joined account model, acceptance could include reconciled billing totals, documented handling of refunds, stable account IDs, useful historical state and a clear process for missing records. Agree tolerances and exceptions with the people who own the source systems.
For lifecycle audiences, verify who enters, who leaves, how suppression works and whether the destination receives changes on time. A correct warehouse query does not prove that a campaign acted on the audience correctly.
For AI access, first define the metric, authorized data and expected answer. Count a benefit only after the user can get a reliable answer with less total work, including checking and correction. Adding an AI interface to inconsistent models can increase review effort.
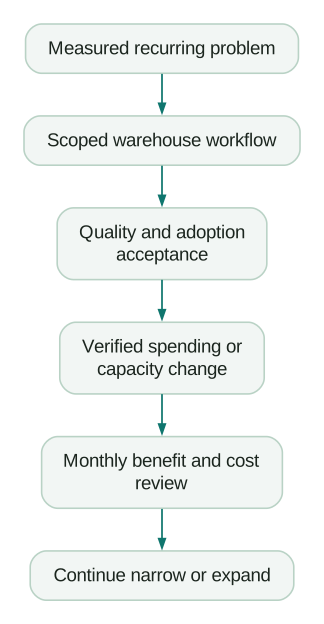
Assign one owner to each benefit and one owner to the ongoing system. Revisit the model monthly during rollout and at the end of each reporting period after launch. Explain differences between forecast and actuals instead of continually revising the original forecast until it appears correct.
When the better decision is to wait
Delay a full warehouse if the current questions are answered adequately by a reliable CRM or billing report, the manual burden is small, or nobody can own the new models. A smaller integration or a documented reporting process may capture most of the benefit at lower cost.
Also pause if the value case depends entirely on unspecified “better decisions.” Name the decision, who will make it differently and how you will observe the result. If that cannot be done yet, treat the project as an exploratory capability investment with a limited budget and a stop point.
A staged build can reduce commitment. Deliver one reconciled model and one adopted workflow, inspect the cost and benefit evidence, then decide whether the next source or audience deserves investment. A three-year model should support that decision, not pressure the team to complete an oversized roadmap.
Business-case checklist
- Baseline effort and spending come from observed workflows and invoices.
- Cash savings, usable capacity and unproven upside are separate.
- Each benefit has an owner, evidence requirement and realistic start date.
- Costs include implementation, overlap, ongoing tools and maintenance.
- ROI, payback and NPV use explicit definitions and timing.
- The model prevents counting the same work or revenue twice.
- Downside cases test adoption, delay and cost assumptions.
- A smaller alternative and a stop or expansion decision are documented.
If you need help turning the baseline into a scoped implementation, data warehouse and CDP services can start with the model and workflows the business will actually use. Bring the recurring problem, current costs and benefit owners; those are more useful starting inputs than a preferred platform logo.
Questions people ask
What is the ROI of a data warehouse?
There is no universal percentage. Calculate the net value of benefits relative to total implementation and operating cost over a stated period. Identify whether the benefits are cash savings, monetized capacity or measured incremental contribution, and whether the calculation discounts future amounts.
How long does a warehouse take to pay back?
It depends on rollout timing, recurring cost and realized benefits. In this illustrative model, capacity-inclusive undiscounted payback occurs in month 15, but cash savings do not repay the investment within 36 months. Those are different results from the same project assumptions.
Can I use staff hours saved as a financial benefit?
You can value useful capacity, provided the hours are actually removed, the rate is defensible and the team can use the time. Keep that value separate from cash savings unless payroll, paid overtime or external spending really decreases. Include the time needed to operate and review the new system.
Should vendor ROI studies guide the budget?
Use them to identify cost and benefit categories and to inspect modeling methods. Replace their inputs with your own baseline, contracts, staffing and adoption assumptions. Sponsored interview studies and enterprise composites do not provide a forecast for your company.
Is a warehouse worth it for a small company?
It can be when important recurring work requires reliable joins, history or activation across systems and someone will own the result. Company size alone is not the decision rule. Compare a narrow warehouse implementation with simpler options and check whether the measured benefit justifies the ongoing responsibility.
Sources
Written by
Jafrin Akter AloData Engineer and Co-founder, martechdevs
Jafrin Akter Alo is a data engineer and co-founder of martechdevs, where the team has delivered 74+ martech, data and growth stack implementations.