
Mixpanel Alternatives: Compare Analysis, Data and Maintenance
Data Engineer and Co-founder, martechdevs
Last updated 10 min read
The right Mixpanel alternative preserves the questions your team needs to answer while improving a specific constraint: report usability, capture coverage, account analysis or operating cost. Shortlist Amplitude, PostHog and Heap against those needs. Then test identical customer journeys and historical definitions before migrating. A familiar funnel chart can produce a different answer from the same events.
Last updated: 17 September 2026.
A product team rarely wants a new analytics tool for its own sake. It wants to stop waiting three days for an answer, explain why activation changed, or reduce a bill that grows faster than useful analysis.
Name that problem before comparing logos. If nobody owns the event definitions, a migration carries the ambiguity into another interface. If the problem is a capability or workflow the team genuinely cannot obtain, a controlled replacement can be worthwhile.
This guide provides a selection process for teams already using Mixpanel. The goal is a defensible replacement decision, including the possibility that repairing the current setup is cheaper and more effective.
What problem should an alternative solve?
Write one measurable outcome with a baseline. Examples include reducing the median time to investigate a release regression, enabling account-level activation reporting, or lowering annual cost while retaining required history.
Avoid “better analytics.” It cannot distinguish a successful evaluation from an attractive demo.
First separate four kinds of problems:
- A collection problem: the success event is missing, duplicated or triggered before the backend accepts the operation.
- A definition problem: teams disagree on whether activation is a user, workspace or completed project.
- An analysis problem: the required question is possible only through awkward workarounds.
- An operating problem: cost, permissions, maintenance or support no longer fits the team.
A product analytics implementation is useful when the first two problems dominate. Changing the interface does not resolve them. The Mixpanel implementation diagnostic can help identify that boundary before a procurement process starts.
Also check whether the supposedly missing feature now exists. Mixpanel currently documents autocapture for supported SDKs, including website interactions. “We need automatic capture” is therefore an evaluation requirement, not sufficient evidence for replacement. Configuration, captured context and suitability still need testing. Mixpanel autocapture documentation.
Which alternatives deserve a serious evaluation?
Amplitude for teams prioritizing event analysis and account reporting
Amplitude belongs on the shortlist when product managers need to investigate behavioral differences with explicit event definitions and compare individual activity with account outcomes.
Two documented details matter during migration. Amplitude records event and user property values at the time events occur. Its account reporting requires groups to be instrumented; a company name somewhere on a profile is not a complete account model. Amplitude event properties, account reporting setup.
The evaluation should ask a product manager to recreate a real analysis without guidance from the person who installed the tool. Give them a question such as: “Which onboarding step changed for new workspaces on the starter plan after the release?” Record the time taken, wrong turns and whether they can explain the population behind the result.
A successful chart is only half the test. Have the analyst change the requirement from users to workspaces. If the model cannot follow that change, the limitation may be instrumentation rather than chart functionality.
Amplitude is a candidate, not an automatic upgrade. A team comfortable with its current reports may gain little from moving equivalent analyses. Our Mixpanel and Amplitude comparison provides a broader starting point; your own report inventory should decide the migration.
PostHog for teams that want analysis close to implementation
PostHog is worth evaluating when engineers and product managers collaborate closely on behavioral investigations and want a flexible event analysis workflow.
Its funnel documentation distinguishes sequential, strict and any-order paths. It also supports different breakdown attribution choices, including selecting a particular step. Those choices can change who remains in a breakdown and how a person is counted. Recreating a chart therefore requires more than copying event names. PostHog funnels.
For B2B products, inspect the group model and commercial consequences together. PostHog connects people to groups through events. Its current group analytics documentation describes a paid add-on charged against all identified events once enabled, including identified events without group properties. PostHog group analytics.
A useful pilot moves a test user between two workspaces and checks that each operation belongs to the correct workspace. Then inspect an event with no group attached. The team should know whether that event is intentionally excluded from an account report, rather than accepting an unexplained difference.
The fit depends on who will maintain this model. A flexible platform still needs ownership of properties, collection rules and changes in application behavior.
Heap for teams that need to define captured interactions later
Heap is worth evaluating when product questions change frequently and the team wants to organize previously captured interactions into meaningful events.
Heap documents automatic collection of supported interaction types, with properties across users, sessions and events. Its definition workflow can organize that captured data later. However, snapshots that add custom property values do not capture those values retroactively. Heap autocaptured data, definition and snapshot workflow.
That distinction should drive the pilot. Choose a question that was not known when capture began. Can the team define the necessary interaction from the stored data? Then choose a question requiring backend context, such as an invoice being settled. A browser interaction alone cannot establish that business outcome.
Evaluate definition maintenance as well. Rename a button, change its location and release a second version of the flow in a test environment. Confirm that the intended business interaction remains identifiable without silently absorbing unrelated clicks.
Heap is most compelling when retrospective interaction analysis solves an actual bottleneck. It is less compelling as a promise that no tracking design will ever be necessary.
When should you keep Mixpanel and fix the data?
Keep repair on the shortlist when your core reports already work and the recurring complaints trace to inconsistent identifiers, missing properties or uncertain event meaning.
Consider a report called “Activation by plan.” In regular Mixpanel profiles, properties represent the current profile state. Event properties preserve context sent with an occurrence. Mixpanel also documents historical profiles through its Warehouse Connectors paid add-on. Those are different mechanisms with different inputs. Mixpanel user profiles.
If the business wants the plan at signup, exporting a current plan field into another tool does not create historical truth. You need the original event context or a valid history of plan changes.
Estimate the repair before assuming replacement is cheaper. A bounded change might add plan_at_signup, correct one identity transition and rebuild three reports. A migration may require those same changes plus historical mapping and staff training.
Replacement becomes more persuasive when the required result remains impractical after the data model is clarified, or when the ongoing economics and workflow still fail the business requirement.
Use a worked example to expose semantic differences
Consider an illustrative trial cohort of 12 workspaces. All started on the starter plan. Eight activated within seven days. By the review date, four had upgraded, and all four upgraders were among the eight activated workspaces.
There are now at least three valid questions:
- What share of starter-plan entrants activated? Eight of 12, or 66.7%.
- What share of workspaces currently on starter activated? Four of eight, or 50%.
- What share of workspaces currently on the upgraded plan activated? Four of four, or 100%.
The underlying behavior has not changed between these reports. The population definition has.
A migration that maps both plan_at_trial_start and current_plan into a single field can produce an apparent activation improvement or decline. The error may survive a check that compares total event volume.
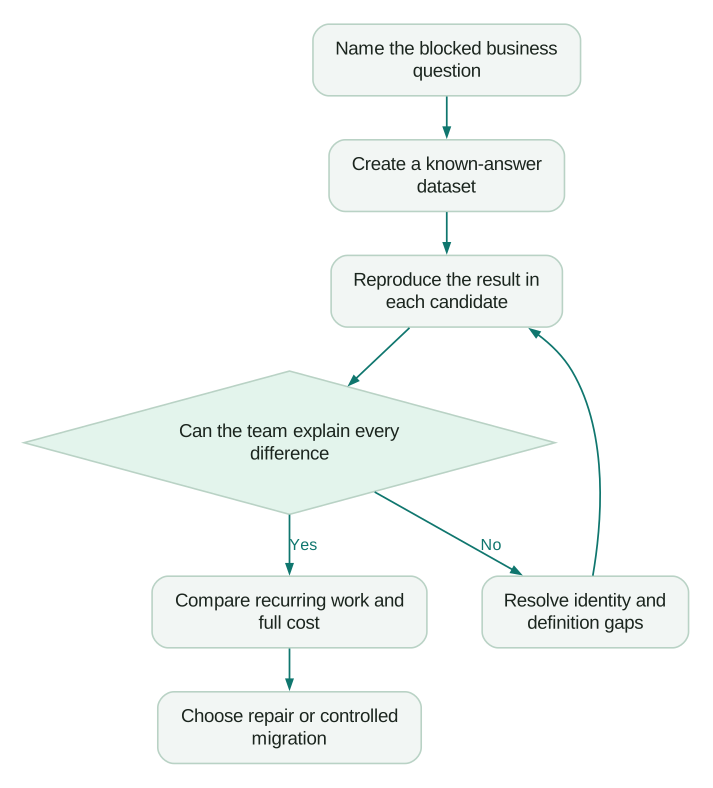
Build a small synthetic dataset with explicit workspace IDs, entry timestamps, activation timestamps, entry plans and current plans. Add two workspaces with multiple members so the test also distinguishes people from accounts.
Ask each candidate to reproduce the three answers. Save its settings and supporting entity list. The acceptance condition is that the team can reproduce and explain each number, not that a default chart happens to show 66.7%.
What should the evaluation specification contain?
Use five decision questions rather than dozens of feature checkboxes.
Activation: Which eligible accounts reached the first value milestone within seven days of trial start? Specify the account key, milestone, starting cohort and treatment of late arrivals.
Retention: Which activated accounts returned to the core behavior during a defined later interval? Specify calendar boundaries or elapsed time and exclude cohorts that have not yet had a full observation window.
Feature adoption: Which eligible accounts used the feature after gaining access? Avoid dividing by all active accounts when only some could use it.
Failure diagnosis: Can the analyst move from an aggregate drop to the underlying events and distinguish a failed operation from a missing success event?
Commercial context: Can the team connect behavior to the correct plan or customer segment at the time relevant to the decision?
For every question, attach a known-answer example and a production sample. The first establishes calculation behavior; the second reveals messy realities such as old versions, missing identities and delayed events.
Compare the cost of a usable answer
Normalize the quote around the same workload: collected events, tracked users where applicable, required history, account analysis, environments, exports, support and any additional products.
Then include migration and operating work. An illustrative internal estimate might contain 40 engineering hours for instrumentation, 24 analyst hours for report recreation and 16 hours for QA and training. At an assumed blended USD75 per hour, that is USD6,000 of internal capacity before subscription overlap. These are planning assumptions, not vendor prices or a service quote.
A proposed USD300 monthly subscription saving produces USD3,600 annual savings before other costs. On those assumptions, subscription savings alone would take 20 months to offset USD6,000, excluding overlap and maintenance. The change could still be justified by faster decisions or a critical capability, but that benefit needs its own evidence.
Measure recurring work in the pilot. How long does it take to add a new business event, revise an account mapping, investigate a missing cohort or review captured sensitive fields? The vendor with the lowest ingestion bill may require more work for your specific setup.
How should the migration protect continuity?
Create an inventory of reports that actually influence decisions. Separate reports used for recurring commitments from exploratory charts that nobody has opened recently. Rebuilding every historical dashboard can consume effort without preserving any useful capability.
For retained reports, record definitions, owners, filters, date rules and expected differences. Map event names and property meanings explicitly. Preserve original timestamps and stable identifiers wherever supported and appropriate.
Do not manufacture unavailable history. If an old field was never collected, label the earliest trustworthy period in the replacement report. If the definition changes, annotate the break rather than stitching two different metrics into a seamless trend.
Run a controlled overlap for the journeys and periods needed to validate the decision. A full retention metric may require longer than an activation check. Prevent two collection paths from doubling business events, and keep a rollback route until critical reports pass acceptance.
The analytics migration guide covers the wider migration work. Your exit criteria should remain specific:
Checklist
- The five evaluation questions have documented definitions and expected answers.
- Historical and current properties remain distinguishable.
- Account membership changes produce the intended entity counts.
- Missing history and changes in calculation are visible to report readers.
- The quote includes the required workload and add-ons.
- Report owners can complete their recurring analysis without the migration lead.
Do not retire the old reporting path merely because the new SDK sends events. Retire it when the team can make its important decisions with the replacement and explain the evidence behind them.
Questions people ask
What is the best Mixpanel alternative?
There is no universal winner. Amplitude, PostHog and Heap deserve evaluation for different workflows, but the deciding evidence is whether they answer your required questions accurately with acceptable cost and maintenance. Start with the constraint you need to improve.
Should we switch to get autocapture?
First inspect your current configuration and requirements because Mixpanel already documents autocapture. Compare the interactions, properties, privacy controls and definition workflow you actually need. Automatic collection still does not establish whether a backend business operation succeeded.
Why do two tools show different activation rates?
They may count different entities, apply different time windows or use properties from different points in time. Identical event totals do not guarantee identical cohorts. Reconcile a small list of known accounts before investigating the entire dataset.
Can we migrate every old dashboard unchanged?
You can aim to preserve the business questions, but exact behavior depends on available data and each tool's calculation rules. Some charts require explicit remapping or a revised definition. Preserve meaningful continuity and document differences rather than forcing superficial visual similarity.
When is repairing Mixpanel the better choice?
Repair is often preferable when identity, event quality or metric ownership causes the problem and the current tool can otherwise answer the question. Estimate that bounded repair alongside the full migration cost. Choose replacement when the remaining capability, workflow or commercial gap warrants it.
Sources
- Mixpanel: Autocapture. Accessed 17 September 2026.
- Amplitude: Add events to charts. Accessed 17 September 2026.
- Amplitude: Account-level reporting setup. Accessed 17 September 2026.
- PostHog: Funnels. Accessed 17 September 2026.
- PostHog: Group analytics. Accessed 17 September 2026.
- Heap: Autocaptured data. Accessed 17 September 2026.
- Heap: Create and manage definitions. Accessed 17 September 2026.
- Mixpanel: User profiles. Accessed 17 September 2026.
Written by
Jafrin Akter AloData Engineer and Co-founder, martechdevs
Jafrin Akter Alo is a data engineer and co-founder of martechdevs, where the team has delivered 74+ martech, data and growth stack implementations.