
How do you figure out your key customer journeys?
Data Engineer and Co-founder, martechdevs
Last updated 12 min read
Your key customer journeys are the paths through which a specific customer reaches an outcome that matters to them and to your business. Identify them by combining customer conversations, product behaviour, support records and commercial outcomes. Then prioritise the journeys with credible evidence of friction, a meaningful consequence and a change your team can actually deliver and measure.
Last updated: 7 September 2026.
A signup, an email open and a renewal each tell you something different. Putting them on the same timeline does not explain what the customer was trying to accomplish, where they got stuck or which change would help. That is the work the journey map needs to support.
For a founder, the useful output is a decision about where to spend limited time. For a product manager, it is an observable problem and a testable change. For a growth or marketing manager, it is enough context to reach the right person at the right moment with something that helps.
This guide works through that decision using a SaaS example. The same method applies to ecommerce, subscription apps and service businesses, with different outcomes and observation windows. Our CRM and lifecycle implementation work connects those outcomes to the systems that deliver the follow-up.
What makes a customer journey worth prioritising?
A journey becomes important when its outcome materially affects the customer's success and there is a credible opportunity to improve it. Traffic volume alone is a poor selection rule.
Consider these candidate journeys:
- First useful result: a new workspace connects its data and produces a report someone uses.
- First successful purchase: a shopper finds the right product, completes payment and receives what they expected.
- Recovery from a failure: a customer encounters an integration error, gets the right help and resumes the task.
- Renewal: an account reviews the value received, resolves outstanding concerns and decides whether to continue.
- Expansion: an existing team identifies another useful application, gets approval and brings more people into the product.
Each has a customer goal, a starting condition and an observable outcome. “Email nurture” describes your delivery mechanism. “Help a trial administrator connect the first data source” describes a problem you can investigate.
Nielsen Norman Group's journey mapping framework, reviewed in 2026, centres the map on an actor and a scenario, then connects their experience to opportunities. Start with that scope before drawing stages.
There are also problems that deserve immediate attention regardless of a ranking exercise. A checkout that charges twice or a cancellation flow that fails needs fixing. A scoring spreadsheet should never become a reason to postpone a known defect.
How narrowly should you define the journey?
Choose one primary actor, one situation and one desired outcome. Keep the scope small enough that you can explain what success looks like without a slide deck.
For a reporting product, “onboarding” is broad. A useful starting definition is:
A newly signed-up workspace administrator connects a supported data source and produces a first usable report within seven days of workspace creation.
The seven-day window is an illustrative operating choice. Select your window from the product's expected use cycle and observed completion times, then document it. An enterprise procurement journey may take months; a password-reset journey should usually be measured in minutes.
Clarify the unit you will count. A team product might have one buyer, two administrators and twenty users. Counting each user as an independent customer can make one successful account look like twenty successes. For account-level onboarding, count eligible accounts and record which person performs each step.
Add a sharing step when collaboration is part of the customer's intended outcome. Solo users should not be classified as failures because they never invited a colleague. Split those use cases before interpreting the numbers.
Where should you look for evidence?
Begin with the evidence you already have, then speak to customers to resolve the gaps. Keep the origin of each finding visible.
Useful inputs serve different purposes:
- Product events establish which instrumented actions occurred, their order and their timing.
- Billing records establish purchases, renewals, failed payments and the amounts involved.
- CRM records add account ownership, qualification and the commercial context surrounding a deal.
- Support conversations reveal questions, errors, workarounds and handoffs.
- Interviews and observation help explain what the person was trying to do and what happened outside your product.
Nielsen Norman Group's research guidance recommends direct customer research alongside existing evidence. A clickstream can show that someone stopped after opening a settings page. It cannot establish whether they were confused, waiting for a colleague or finished for the day.
Recruit people with different outcomes: recent successes, stalled attempts, customers who needed help and people who left. Include the relevant roles. A buyer's explanation of the purchase and an administrator's explanation of the setup may describe different obstacles.
Use questions tied to a real recent attempt:
- What were you trying to get done when you started?
- What happened immediately before you opened the product?
- Show me the point where you had to stop or ask someone for help.
- What information or permission were you missing?
- What did you do next, including outside the product?
- How did you decide whether the task was finished successfully?
These are suggested interview prompts, not a validated survey instrument. Avoid asking people to agree with your preferred explanation. “Was the integration screen confusing?” narrows the answer before you have heard what happened.
Record the behaviour, the customer's explanation and your hypothesis separately. If two interviewees mention an approval delay, you have a lead to investigate. You do not yet know what proportion of all customers experiences it.
How do you connect the evidence without creating a misleading funnel?
Write the counting rules before comparing completion rates. The rules determine whether the journey is performing poorly or the report is simply counting different things.
For each analysis, specify:
- Eligibility: which customers could reasonably complete the journey, and which are excluded.
- Entry event: the first observable point at which the journey begins.
- Outcome event: the evidence that the customer achieved the intended result.
- Entity: person, account, workspace, order or subscription.
- Window: how long each entrant gets to complete the outcome.
- Repeat policy: whether a second attempt starts a new journey or belongs to the original one.
- Observation cutoff: the latest point through which data is complete enough to use.
Give every entrant the full completion window. If your measure is completion within seven days, yesterday's signups cannot yet be classified as seven-day failures. Keep immature cohorts separate until their window closes.
Check a small set of real timelines against the source systems. Look for duplicate events, missing mobile activity, internal test accounts and workspaces merged under the wrong customer. If product and CRM identities do not agree, the product data in HubSpot guide explains the mapping decisions to settle first.
A funnel measures completion of a sequence you specify. A path analysis helps discover the sequences people actually take. Amplitude's funnel interpretation documentation makes that distinction explicit.
Use both views, with their counting rules visible. Amplitude also documents differences between its Journeys and funnel charts, including repeated-event handling and hidden events. Different chart totals can be a consequence of configuration. Investigate the definitions before interpreting the difference as customer behaviour.
How do you decide which journey to improve first?
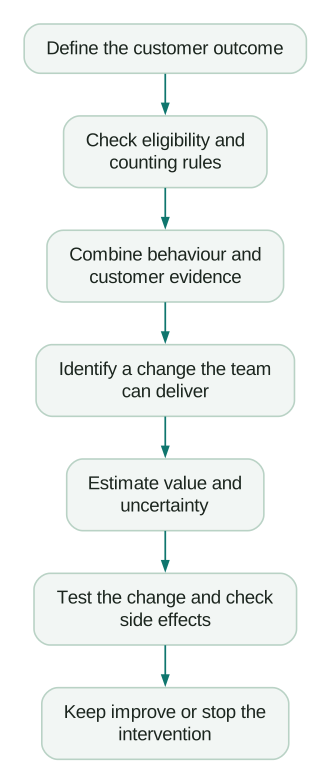
Compare the size of the addressable problem, the strength of the evidence and your ability to change the outcome. Keep uncertain assumptions as ranges rather than compressing them into a precise-looking score.
For each candidate, answer these questions:
- What does failure cost the customer? A delayed task, an unusable purchase, repeated work or lost access each calls for a different response.
- How many eligible customers encounter it? Use a defined cohort and separate the people who could benefit from those who cannot.
- What evidence supports the cause? Combine observed behaviour with customer explanation and technical checks.
- What can we change? Name the product improvement, operational handoff or assistance you would test.
- Who can deliver it? Include engineering, support and data dependencies.
- How will we know whether it helped? Choose an outcome, a measurement window and checks for unwanted effects.
A frequent problem with a weak explanation may need research first. An infrequent problem with a severe consequence may need an immediate fix. A large commercial opportunity with no feasible intervention belongs in a discovery backlog until you can act on it.
This sequence keeps the decision grounded:
What does this look like in a real planning decision?
Illustrative example: a small reporting SaaS has 200 eligible new workspaces in a monthly cohort. Every workspace has had a full seven days to complete setup. Of those, 120 connect a data source and 60 produce a first usable report.
The entry-to-outcome completion rate is 60 / 200 = 30%. Among workspaces that connect a source, it is 60 / 120 = 50%. Both numbers are valid, and they answer different questions.
The team initially proposes more onboarding emails. After reviewing support cases and speaking to administrators, it identifies two separate problems: some need another person's credentials to connect a source, while others cannot tell whether imported data is ready to use.
Those problems suggest different changes. An explicit handoff to the credential owner may help the first group. A clear import-status screen and a relevant sample report may help the second. Sending the same reminder to everyone would conceal that distinction.
The product manager proposes testing the import-status change with eligible connected workspaces. The growth manager defines the follow-up for customers whose import completes successfully. Support agrees on the escalation route when an import fails. The founder can now assess a bounded project with named owners.
Estimate the commercial value without claiming a result
Suppose the planning hypothesis is that the change could increase overall seven-day completion from 30% to 36%. Across a comparable cohort of 200 workspaces, that is 12 additional completions. If the share connecting a source stays at 60%, completion among those connected workspaces would need to rise from 50% to 60%.
Suppose further that 25% of those additional completers would become paying customers, with $180 in collected revenue each over the next 90 days and an 80% gross margin. The estimated gross profit for that cohort would be:
Additional completions: 200 × (36% - 30%) = 12
Additional paying customers: 12 × 25% = 3
Estimated 90-day gross profit: 3 × $180 × 80% = $432
Every input after the current completion rate is an assumption in this example. The $432 is a scenario, not a forecast or an observed return. A $2,000 build would not recover its cost from this cohort alone. Repeated future cohorts could change the business case, but only if volume, conversion, margin and the effect persist.
That calculation is useful even when it makes the project look smaller. It can point the team toward a cheaper intervention, a different journey or a reason to gather more evidence before building.
Do not convert the historical payment rate of successful users into a causal promise. Customers who finish setup may already have stronger intent. Improving a setup metric must still be checked against later customer value.
What should the journey brief contain?
Keep a working brief that another person can use to implement and evaluate the change. A useful version fits on a page before supporting evidence is attached.
Journey: First usable report
Primary actor: New workspace administrator
Customer goal: Answer a real reporting question
Entry: Eligible workspace created
Success: Valid first report produced within the defined window
Counting unit: Workspace
Exclusions: Internal workspaces and unsupported source types
Evidence: Linked timelines, support cases and interview notes
Observed friction: Import status and next action are unclear
Proposed change: Explain readiness and offer a relevant report
Owner: Named product owner, with support and data counterparts
Primary measure: Eligible workspaces reaching the outcome
Follow-up: Paid conversion and retained use after maturation
Guardrails: Errors, support demand and unwanted messages
Decision date: After the agreed observation window closes
Attach a tracking plan that defines the events and properties needed to verify this brief. Record the customer account on each relevant event, and keep a history of the definition when you change it.
The map should also show human handoffs. If an administrator needs a security approval, include the approver and the information they need. That work may happen in email or a call, outside the product analytics tool.
How do you test whether the change helped?
Choose a test that measures the customer outcome and fits the unit affected by the change. For a shared workspace experience, different users in the same account can influence each other.
Microsoft's experimentation guidance explains why the randomisation unit matters when collaborators share an experience. Account-level assignment can reduce conflicting treatment within a team, but it also leaves fewer independent units. Plan the analysis around that constraint.
Where a randomised test is feasible, assign eligible entities consistently, preserve the comparison group and agree on the primary measure before the test begins. Check assignment and data quality before interpreting the outcome. Microsoft's sample ratio mismatch guidance describes one useful check for unexpected differences in group sizes.
Track the immediate outcome and the consequences you might otherwise miss. Faster setup is less valuable if it produces unusable reports, additional support work or customers who cancel after the first invoice.
With low volumes, a small test may leave substantial uncertainty. Use customer observation and technical checks to improve the proposed change, and report before-and-after results with their limitations. Seasonality, acquisition mix and other releases can change the same metric. Avoid presenting an uncontrolled comparison as a proven causal lift.
When should lifecycle messaging enter the journey?
Add a message when the customer has a useful next action, the recipient can take it and the timing reflects their current state. Product fixes and operational help often need to come first.
A delayed import might call for an honest status update. Missing credentials might call for a handoff to an administrator. A completed task should stop its reminder immediately. Define re-entry rules so repeated events cannot restart an irrelevant sequence indefinitely.
Our lifecycle journey examples cover triggers, required context, exit conditions and outcome metrics. For accounts already at risk of leaving, the AI churn prevention guide explains how to connect a risk signal to a useful intervention and test its effect.
At Martechdevs, we connect product, billing and CRM data so the journey can be measured and the follow-up can use the right context. A free martech audit is useful when you have identified a journey but need help establishing the data, ownership or implementation work behind it.
Checklist before you prioritise a journey
- The primary actor and customer outcome are specific.
- Eligibility, entry, completion and the counting unit are documented.
- Every analysed customer has had the full observation window.
- Successful, stalled and departed customers inform the research.
- Observed facts are separated from customer explanations and hypotheses.
- Product events reconcile with the relevant CRM or billing records.
- The proposed change addresses an evidenced obstacle.
- Someone owns the change and its cross-team dependencies.
- Commercial estimates show their assumptions and arithmetic.
- The evaluation includes downstream outcomes and unwanted effects.
- Messages have useful actions, eligibility checks and exit rules.
- The team has a decision date and a clear reason to keep, revise or stop the change.
Questions people ask
How many customer journeys should a small team prioritise?
Start with as many as the team can investigate, implement and evaluate properly. One well-defined journey is a sensible first project when ownership or tracking is still unclear. Add more when you can name the owner and measurement plan for each, rather than choosing an arbitrary target number.
Is a customer journey the same as a marketing funnel?
A marketing funnel describes progression through selected commercial stages. A customer journey follows a person's attempt to achieve a goal, including product use, support, delays and activity outside your systems. The funnel can be one measurement view within that broader investigation.
Can we map journeys before our tracking is complete?
Yes. Use customer conversations, support records and observed tasks to create a provisional map, marking the gaps explicitly. Instrument the events needed to answer the first decision rather than waiting to track everything. Avoid attaching precise conversion rates to a map whose eligible population or outcome is incomplete.
Should we prioritise the step with the highest drop-off?
Investigate it, then establish whether the drop-off is unexpected and addressable. Some entrants are ineligible, some return later and some have already achieved their goal another way. Prioritise the obstacle you can credibly improve after checking the counting rules and customer evidence.
Can AI identify our key customer journeys?
AI can help organise approved interview notes, summarise support themes and explore defined event data. Have it link every conclusion to its evidence and label unknowns. Your team still needs to validate the customer goal, the data definitions and whether the proposed intervention actually helps.
Sources
- Nielsen Norman Group, Journey Mapping 101, 2018, reviewed July 2026.
- Nielsen Norman Group, How to Conduct Research for Customer Journey-Mapping, 2019.
- Amplitude, Interpret your funnel analysis, documentation accessed 7 September 2026.
- Amplitude, Understand and use the Journeys visualizations, documentation accessed 7 September 2026.
- Microsoft Research, Patterns of Trustworthy Experimentation: Pre-Experiment Stage, 2020.
- Microsoft Research, Diagnosing Sample Ratio Mismatch in A/B Testing, 2020.
Written by
Jafrin Akter AloData Engineer and Co-founder, martechdevs
Jafrin Akter Alo is a data engineer and co-founder of martechdevs, where the team has delivered 74+ martech, data and growth stack implementations.