
Mixpanel vs Amplitude vs PostHog Pricing at 500K, 3M and 15M Events
Data Engineer and Co-founder, martechdevs
Last updated 11 min read
A product analytics bill depends on what you collect, how you identify customers and which capabilities you need. Comparing headline event rates skips those decisions. This guide prices three workloads, makes the assumptions explicit and shows where a cheap estimate can become an expensive implementation.
Last updated: 17 September 2026.
What these prices include
This comparison uses public pricing and live calculator observations checked on 17 September 2026. Amounts are USD, before tax. It excludes negotiated discounts, startup credits, implementation work and optional paid products beyond the stated analytics configuration.
Mixpanel figures use its selected monthly Growth volume tier, not an assumption that every event above the free allowance costs the entry overage rate. Amplitude figures use its current event-volume Plus estimator. PostHog figures include the calculator's base event charge and person-profile charge for an entirely identified event stream.
A recorded session, a feature-flag request, an experiment participant and an analytics event are different units. A tool may include some of each without making them interchangeable. Keep those volumes separate in the budget.
Existing accounts can have different terms. Confirm the plan, meter and additional-data rate in your account or order form before using a public estimate to approve spend. A historical contract is not necessarily repriced when a marketing page changes.
Monthly analytics cost at the three volumes
The following are the selected monthly-payment estimates from Mixpanel's calculator, Amplitude's calculator and PostHog's calculator. All-identified PostHog totals are intentional; the cheaper anonymous-only case appears below.
At 500,000 events per month
- Mixpanel: $0 within its analytics allowance.
- Amplitude: $0 within its analytics allowance.
- PostHog: $0 within its analytics allowance, including this all-identified scenario.
At this volume, start with required features and the work needed to obtain a trustworthy answer. A free allowance is useful only if the plan supports the report and access model you need. Do not purchase a larger event commitment to solve an instrumentation problem.
At 3 million events per month
- Mixpanel Growth, selected monthly tier: $378.
- Amplitude Plus, monthly payment: $94.
- PostHog, 3 million identified events and no Group Analytics: $352.
These are analytics configurations, not equivalent feature bundles. Ask whether account-level analysis, required retention, exports and permissions fit the selected plan before comparing the totals as if they were quotes for the same system.
At 15 million events per month
- Mixpanel Growth, selected monthly tier: $1,722.
- Amplitude Plus, monthly payment: $1,170.
- PostHog, 15 million identified events and no Group Analytics: $1,600.
At this scale, also inspect how many events represent useful business behavior. Fifteen million carefully designed observations and fifteen million repeated UI events can cost similar amounts while supporting very different decisions.
Why the entry rate gives the wrong Mixpanel comparison
Mixpanel's billing reference lists $0.00028 per additional event on its one-million-event monthly Growth plan, with lower rates at larger purchased volumes. Entry-plan overage would therefore cost $560 at three million events and $3,920 at fifteen million, before add-ons. Both exceed the selected-tier estimates above. Your subscribed tier determines the applicable rate.
At 1.1 million events, entry-plan overage is $28. Its documented Group Analytics surcharge of 40% adds $11.20; the Data Pipelines surcharge of 20% adds $5.60 if subscribed. Both would make this illustrative overage $44.80. Confirm your contract before applying these percentages.
The purchasing question is which volume and commitment fit your expected usage, and what happens above it. Save the selected tier, included volume and additional-data rate together. A screenshot showing only a dollar figure leaves too much undefined.
Why PostHog's base event rate is not the identified total
The PostHog analytics price page publishes a base schedule: the first million events are free, the next million cost $0.0000500 each and the next thirteen million cost $0.0000343 each. That yields $84.30 at three million and $495.90 at fifteen million before person-profile charges.
The main calculator's expanded breakdown adds a person-profile charge on identified events. At three million identified events, its components total $84.30 plus $267.70, or $352. At fifteen million, they total $495.90 plus $1,104.10, or $1,600. Use the full breakdown rather than reading the base rate as an all-inclusive logged-in analytics price.
A mixed example makes the distinction clearer. With fifteen million total events but only three million identified, the current calculation is $495.90 plus $267.70, or $763.60; the calculator displays $764 after rounding. This is a different workload from fifteen million identified events.
PostHog's identity documentation explains the analytical tradeoff: anonymous events do not support person cohorts or group analysis. Web and backend defaults differ, and an opaque internal identifier can still produce an identified event. Removing email addresses alone does not make the billing classification anonymous.
Decide where person history is needed before changing collection. A public documentation page may need aggregate engagement. A logged-in onboarding journey may require cross-session identity and account context. Price those requirements separately rather than destroying useful context to make the estimate smaller.
The calculator and documentation use different presentations of the billing components. For a purchase or renewal, reconcile the account's actual invoice labels and event classifications with the current estimator. Do not combine a legacy rate from one page with a new allowance from another.
Annual payment changes the comparison
With annual payment selected, the observed monthly equivalents are $270 for Mixpanel at three million and $1,230 at fifteen million. Amplitude's annual toggle shows $75 and $936 respectively. These are annual-payment estimates expressed monthly, not cancellable monthly subscriptions at those prices.
For a constant three-million monthly scenario, the displayed Mixpanel annual equivalent is $3,240 for twelve months, compared with $4,536 from twelve $378 monthly estimates. The difference is $1,296. For Amplitude, twelve displayed $75 equivalents total $900 versus $1,128 from twelve $94 monthly estimates, a $228 difference. These calculations use rounded public displays; checkout and contract amounts govern.
Do not compare an annual equivalent for one vendor with an uncommitted monthly amount for another and call the difference product efficiency. First choose a common payment assumption. Then decide whether the annual commitment is worth its discount for your business.
Model the downside of a forecast that is too high. If acquisition slows or you retire a noisy event, prepaid capacity may not produce the saving you expected. Conversely, a rapidly growing product needs to know the cost of excess usage and the process for changing tiers.
A practical procurement note should record payment timing, volume period, unused allowance treatment, overage rules, upgrade timing, renewal terms and any cancellation obligations. The cheapest month in a screenshot does not establish the cheapest year of ownership.
Check feature gates before calling a plan free
Amplitude currently includes two million monthly events; Mixpanel and PostHog include one million. The public plan pages also distinguish saved content, cohorts, projects, retention and access capabilities. A larger free event allowance is not automatically the better operational fit.
For B2B reporting, verify account-level analysis explicitly. Mixpanel's Group Analytics guide places it in a Growth or Enterprise add-on. PostHog's group billing guide says subscribing applies the meter to all identified events in the project, not just events with group properties.
In the observed PostHog three-million identified-event scenario, enabling Group Analytics changed the displayed total from $352 to $453. That is an observed rounded estimate, not a universal percentage surcharge.
Amplitude's public comparison marks group behavior as available on Plus, while its expanded Accounts package section names Growth and Enterprise. Confirm the exact account-level capability and package required for your report. Do not assume that every feature described under Accounts is included in the base Plus estimate.
For all three, write the required behavior in plain language. “Count workspaces that activated when different colleagues completed the steps” is more useful than “needs B2B analytics.” The vendor can then confirm the feature, plan and instrumentation needed to deliver it.
Our PostHog versus Mixpanel workflow comparison includes a small account-versus-person example you can use to test that requirement.
Replay, experiments and exports need separate forecasts
Start with the products you will enable, rather than adding every available feature to the estimate. For each one, record its billing unit, included quantity, extra rate, sampling policy and owner.
Mixpanel's release announcement specifies 1,000 monthly experiment users and ten active flags on Free, with 5,000 experiment users and fifty active flags included on Growth. Extra capacity is a separate question from analytics event volume. Existing exposure integrations also need a clear definition of which users qualify.
For replay, estimate actual recorded sessions. In an illustrative product with 80,000 eligible sessions and a genuine independent 10% recording sample, the expected count is 8,000 recordings, not a guaranteed maximum. Targeting, minimum-duration rules or sessions recorded outside that sample can change the total and the population represented.
Do not compare a sampled replay allowance with complete event history. They answer different questions. Preserve the collection configuration alongside replay findings so someone investigating a bug knows which sessions were eligible to appear.
For warehouse data, distinguish loading information into the analytics tool from exporting it back out. Mixpanel's warehouse connector documentation ordinarily bills event inserts at ingestion time, with legacy exceptions. Mirror updates and deletes also count. Dropping and recreating a mirrored table can bill both the deletion and reinsertion of its rows. An old timestamp does not automatically make a backfill free.
The same documentation distinguishes standard profile syncs from Profile History: history rows, updates and deletes can be billable. Inventory new records, corrections and rebuild behavior before enabling a connector. Ask for the migration allowance separately, and include warehouse compute and egress in the estimate.
Build a usage forecast from behavior, not registrations
Registered accounts are not monthly active people, and monthly active people are not events. Build the estimate from the activities that actually produce billable records.
Suppose 12,000 people use the product during a month. Each has five sessions, and your intended collection sends eight qualifying events per session. That is 480,000 events. Add 120,000 backend business events and the operating estimate becomes 600,000.
Now suppose broad interaction capture adds forty extra events per session. That adds 2.4 million events, taking the total to three million. The customer count did not change. The instrumentation decision changed the volume by five times.
This example is a planning model, not a vendor benchmark. Replace each assumption with observed usage from a representative period. Separate browsers, mobile apps, backend services, warehouse imports and internal environments so a spike has an identifiable cause.
Use at least three scenarios: expected operation, a plausible growth case and an instrumentation fault. A duplicated integration or rapidly firing event can dominate a bill faster than healthy customer growth.
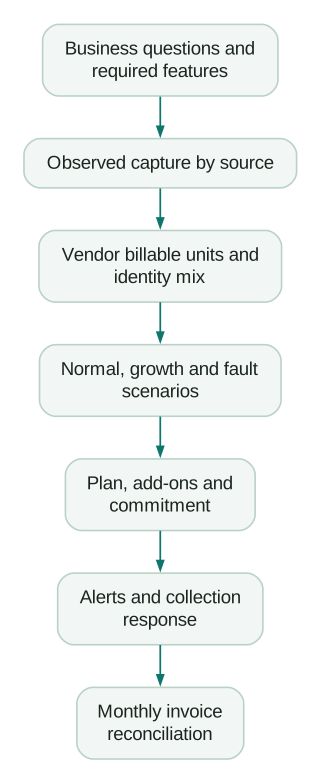
For event volume, use a forecast record such as this original worksheet. These are planning inputs, not a vendor payload:
monthly_active_people: 12000
sessions_per_person: 5
intended_events_per_session: 8
backend_events: 120000
optional_extra_autocapture_events_per_session: 40
expected_events_without_extra_autocapture: 600000
expected_events_with_extra_autocapture: 3000000
A single average can hide a small group of very heavy users. If enterprise accounts behave differently from individual trials, forecast them separately. Preserve those segments when checking whether a proposed event reduction removes information needed for your most valuable customers.
The tracking plan guide helps assign each retained event a business purpose, producer and owner. That makes cost reduction a review of unnecessary work rather than an arbitrary percentage cut.
A spending cap and a complete dataset are different outcomes
PostHog's billing limits documentation says collection and processing stop beyond a configured limit, with additional data permanently lost. Limits are per product; owner alerts are sent at 80% and 100%. Design the response before the threshold is reached.
Mixpanel's billing reference says its Free limit restricts report access while collection continues. Growth excess usage can produce additional charges, and its documentation does not offer a hard billing cap. These are different failure modes and need different operating responses.
Assign someone to investigate a volume alert, identify the producing source and decide whether to adjust collection or commercial capacity. Protect essential outcomes before reducing optional interaction events. Record any missing period in downstream reports.
Compare invoice usage with ingestion evidence each month. Track product usage growth separately from capture changes, retries, historical imports and corrections. When a cost increase is explained by a deliberate rollout, update the forecast. When it is unexplained, investigate before making a larger annual commitment.
Do not treat a quiet bill as proof that the setup is healthy. Lost collection can lower both cost and apparent activation. The finance check and the data-quality check should meet in the same operating review.
Choose the lowest cost that still supports the decision
A founder needs to know the cash commitment and the work the team must absorb. A product manager needs reliable behavior and release analysis. Growth needs a defensible cohort and a way to act on the result. The useful choice satisfies those needs with a cost the business understands.
Compare subscription spend, implementation, recurring maintenance and the tools you can genuinely retire. Keep hypothetical revenue improvement separate from verified savings. Better analysis can create value, but buying a plan does not prove that value has occurred.
Checklist
- Monthly volume uses qualifying events, not registered users.
- PostHog's estimate includes the intended identified-event mix.
- Account-level analysis and its add-on are priced explicitly.
- Monthly prices and annual equivalents are compared on the same basis.
- The selected tier and additional-data rate are recorded together.
- Replay, experiment, AI and pipeline meters have separate forecasts.
- Historical imports and corrections have an agreed billing treatment.
- Required retention, projects and permissions fit the proposed plan.
- Limit behavior, alerts and a response owner are documented.
- The final account quote has been checked against the public estimate.
Our product analytics service can help measure the actual event stream, reconcile the reports and price the configuration your team needs. Start with a bounded question and evidence of current usage; the purchase becomes easier to justify when both are clear.
Questions people ask
Which tool has the largest free event allowance?
Among these current public offers, Amplitude has the largest. Compare required features and the consequences of reaching a limit as well as the event count. An allowance that cannot support the needed report does not resolve the buying decision.
Why does Mixpanel's calculator differ from multiplying its entry event rate?
The entry plan's additional-data rate and a larger selected volume tier are different purchasing choices. Use the rate attached to the actual subscription, and include any subscribed add-ons. A higher-volume public estimate is not automatically applied to an existing account.
Should I use PostHog's anonymous-event price for a logged-in product?
Only if that matches the intended collection and analysis. Person cohorts and account journeys often need identified context. Model the real event mix and inspect the calculator's full breakdown rather than using the cheapest displayed component.
Are the annual figures billed monthly?
A displayed monthly equivalent describes the annual-payment option. Check the checkout or agreement for payment timing, committed quantity and changes during the term. Do not assume it has the cancellation flexibility of a monthly plan.
Does a lower analytics bill mean the implementation is better?
No. The bill can fall because unnecessary events were removed, or because important data stopped arriving. Check collection completeness and whether the team can still answer its priority questions before calling the reduction a success.
Sources
- Mixpanel: Pricing calculator and plan comparison
- Amplitude: Pricing calculator and plan comparison
- PostHog: Pricing calculator and identified-event breakdown
- Mixpanel: Billing, overages, add-ons and ingestion accounting
- PostHog: Base analytics event tiers
- PostHog: Anonymous and identified events
- Mixpanel: Group Analytics availability
- PostHog: Group analytics billing
- Mixpanel: Free and Growth experiment and flag allowances
- Mixpanel: Warehouse connector sync modes
- PostHog: Billing limits and alerts
Written by
Jafrin Akter AloData Engineer and Co-founder, martechdevs
Jafrin Akter Alo is a data engineer and co-founder of martechdevs, where the team has delivered 74+ martech, data and growth stack implementations.