
Mixpanel AI vs Amplitude AI: Compare Answers to Real Product Questions
Data Engineer and Co-founder, martechdevs
Last updated 10 min read
Choose between Mixpanel AI and Amplitude AI by testing the product decisions your team actually makes. Give both the same metric definitions, equivalent data and questions with known answers. Compare correctness, inspectable evidence, follow-up effort and operational fit. A polished response is useful only when its population, time window and calculation match the decision you need to make.
Last updated: 1 October 2026.
“Which AI is better?” is too broad for a purchasing decision. A product manager investigating onboarding, a growth lead reviewing acquisition quality and an analyst checking retention need different capabilities. Start with the work that currently takes too long or produces disagreement.
If your event definitions are inconsistent, improve the product analytics foundation before using an AI comparison to justify a migration. Otherwise, the test mostly measures which assistant guesses your undocumented conventions more convincingly. This guide provides an evaluation you can run with your team; it does not present an invented benchmark or claim that either product was tested in a private customer account.
What are you comparing today?
Mixpanel Agent is the current evolution of Spark. Its documentation describes report and cohort creation, investigation of existing analyses, session replay analysis, and interactions with experiments and automations. The relevant comparison is therefore broader than a prompt that produces a chart. Check the current Mixpanel Agent documentation against the features enabled in your project.
Amplitude distinguishes Global Agent for conversational analysis from specialized and custom agents for more focused work. Its MCP server provides an external assistant interface. Agent Analytics, which measures agents your company builds, is a different use case. Amplitude's AI overview explains these surfaces and notes that some agents depend on related features.
Write the exact interfaces into your evaluation record. Comparing Mixpanel's in-product agent with an unrelated model connected to Amplitude through MCP changes more than the analytics platform. It also changes the model, available tools, permissions and context. That may be the workflow you intend to buy, but label it accurately.
For broader platform considerations, use the separate Mixpanel versus Amplitude guide. Here, the question is whether the AI makes your analysis more dependable and less expensive to complete.
How do you prepare an equivalent test?
Choose a product area with understood data and at least one recent decision. Onboarding is often suitable because it connects acquisition, activation and early retention. Restrict the initial test to a bounded population and dates for which the underlying events are complete.
Prepare a reference packet containing:
- The decision the team wants to make and the person accountable for it.
- Exact event and property definitions, including deprecated alternatives.
- The unit of analysis: person, account, session, order or another entity.
- Cohort eligibility, exclusion rules and observation windows.
- A manually checked reference analysis with its underlying counts.
- Known instrumentation changes and unresolved gaps.
If both platforms are already instrumented, reconcile the test population before evaluating either AI. Differences in identity handling, event arrival or filtering can create different answers even when both assistants interpret the question correctly. If you are testing a new implementation, use a reconciled pilot dataset rather than claiming the complete production projects are equivalent.
Give both products the same business context in their supported format. Mixpanel supports organization and project context, with project-specific information refining broader definitions. Its documentation also warns that MCP context updates replace the whole target document. Preserve the existing content when preparing your test. See Mixpanel Business Context.
Amplitude also supports organization and project context, with project context taking precedence when definitions conflict. Its AI controls accept instructions and supporting reference files. Use the same substantive definitions in both systems even if their upload mechanisms differ. These controls are documented in Amplitude AI settings.
Which questions expose meaningful differences?
Use several kinds of task. A product can handle a simple count well and still fail when a follow-up changes the population.
1. Retrieve a known metric
Ask for the number of eligible new accounts that activated within seven days of signup. The expected answer includes the qualifying account count, denominator, rate, date boundaries and a reproducible analysis.
This checks whether the assistant selects the correct events and entity. It also reveals whether it silently substitutes users for accounts or uses all recent signups before they have completed the observation window.
2. Preserve meaning during a follow-up
Ask to break the same result down by acquisition source, then exclude internal accounts. Verify that “same result” preserves the original cohort, conversion window and account-level definition. A convincing chart with a changed denominator should fail this task.
3. Investigate a movement
Provide a known activation decline and ask for plausible explanations supported by evidence. Reward a clear separation between observed segment changes, instrumentation changes and untested hypotheses. The assistant should avoid treating the largest correlated movement as a proven cause.
4. Handle missing evidence
Ask a question whose answer the project cannot support, such as whether a specific onboarding email caused activation when there is no suitable experiment or exposure record. A useful response identifies what is missing and proposes a measurement approach. An invented causal explanation is a material failure.
5. Produce a reusable artifact
Ask for a saved analysis or a proposed recurring review with a named owner. Inspect the artifact itself, including filters and permissions. A summary that looks correct while pointing at a differently configured report is not an acceptable result.
A worked example: incomplete cohorts change the answer
Consider an illustrative B2B onboarding analysis. The team defines activation as an account publishing its first completed project within seven days after signup. At the extraction time, 80 eligible accounts have had a full seven-day observation period. Of those, 32 activated within their window.
Another 20 accounts signed up more recently. Four have already activated, but the remaining accounts have not had seven days to do so. The complete-cohort activation rate is 32 divided by 80, or 40%. Combining all 100 accounts gives 36%, which answers a different question because some observations are unfinished.
This example does not imply that either vendor makes this mistake. It creates a small, checkable case your team can use to evaluate an assistant's reasoning.
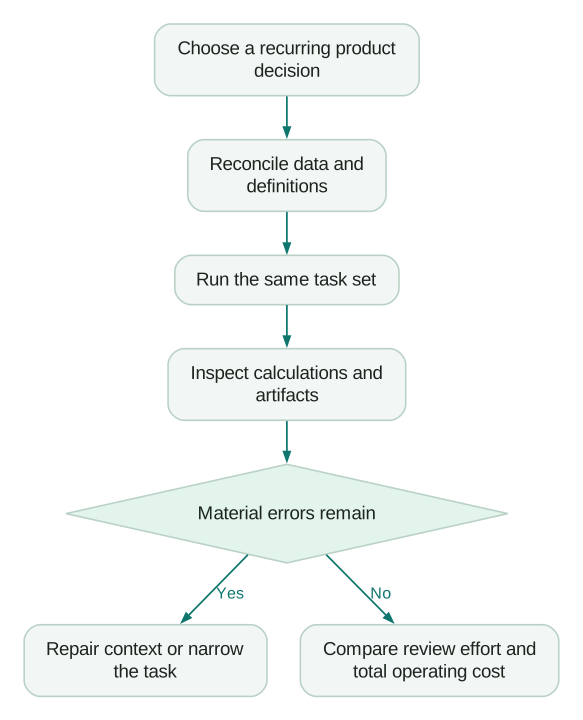
Give the assistant the business definition and ask it to compare recent cohorts. A strong answer either restricts the calculation to complete cohorts or explicitly labels the newer cohorts as incomplete. It should also preserve the same window when you request an acquisition-source breakdown.
Now add a complication: one account has three users who each publish a project. The activation numerator should still count that account once under this definition. Ask the assistant to explain how the report handles the distinction. If the platform setup does not support the required account analysis, record that as an implementation or plan limitation rather than allowing the assistant to improvise.
Finally, ask whether an onboarding redesign caused the observed difference. Even a correctly calculated rate cannot establish that without an appropriate comparison design. The next useful step may be an experiment, a segmented investigation or an instrumentation repair. It is not automatically a product rollout.
The SaaS activation metrics guide helps define the underlying milestone before you evaluate how well an agent analyses it.
How should you score the results?
Use a rubric that separates correctness from convenience. For each task, score five dimensions from zero to two:
- Definition fidelity: wrong definition, partly specified definition, or exact agreement with the reference.
- Numerical correctness: incorrect result, corrected after intervention, or correct first result.
- Evidence: unsupported summary, partially inspectable evidence, or a fully reproducible analysis.
- Uncertainty: unsupported certainty, incomplete caveats, or appropriate limits and next checks.
- Usability: substantial reconstruction, manageable editing, or a result the owner can use directly.
These are proposed evaluation rules, not vendor ratings. Keep the detailed failures as well as the total. A score of eight can conceal a serious numerical error if the answer is easy to read and share.
Record active analyst minutes separately from elapsed response time. Include the time required to inspect, correct and explain the output. Repeat consequential tasks in a fresh conversation so the result does not depend entirely on corrections made earlier in the demonstration.
You can estimate operational value with a simple hypothetical calculation. Suppose 40 recurring analyses each require 25 active minutes without assistance. That is 1,000 minutes. If assistance reduces the work to 8 minutes plus 5 minutes of review per analysis, the new total is 520 minutes. The potential saving is eight hours before setup and maintenance. If the team needs an additional eight hours each month to repair unreliable outputs, the apparent efficiency disappears.
Keep licence and implementation cost separate from this time estimate. A platform migration needs a stronger case than a modest improvement in one analysis. Existing event history, trained staff and maintained reports all affect the decision.
Which controls deserve a closer look?
Mixpanel's current documentation says Verified Mode prioritizes verified data and flags unverified results. It explicitly says the mode does not exclude requested data. Treat it as a trust signal in analysis, rather than a substitute for access restrictions. This distinction matters when a team assumes a familiar feature name guarantees a hard boundary. See the Verified Mode explanation.
Amplitude's custom agents can operate on a schedule and use authorized external connectors. That adds a different evaluation task: inspect where an agent can write and who owns its recurring work. A helpful analysis can still create operational noise if it repeatedly files the same issue. The custom agent documentation describes their configuration and permission model.
Both vendors describe controls against third-party model training on customer data. Review the actual agreements and data path for your chosen surface. Mixpanel notes that external AI tools connected through MCP follow the agreement with that provider; its own policy also distinguishes feature improvement from model training. Amplitude documents tenant isolation, existing access controls and its AI processing arrangements. Read Mixpanel's AI policy and Amplitude's AI privacy documentation alongside your account configuration.
Do not award a product a blanket governance score because an administrator screen exists. Demonstrate the specific boundary that matters to your team: the analyst can access the correct project, cannot retrieve an excluded project, and produces a shareable result visible only to its intended audience.
How do you make the final decision?
If one platform already holds trusted product data, evaluate its native AI first. The implementation advantage may outweigh a small difference in conversational style. Consider switching when repeated, important tasks remain materially harder or less reliable after reasonable context and instrumentation improvements.
For a new purchase, choose the platform that supports your analysis model and operating process, then use AI performance as part of that assessment. Account-level analysis, experimentation, replay workflows, access controls and data maintenance remain consequential even when an assistant makes the interface easier to use.
Before expanding the pilot, confirm:
Checklist
- Equivalent test populations reconcile across the reference and candidate projects.
- The agent preserves account or user definitions through follow-up questions.
- Incomplete cohorts and missing evidence are clearly identified.
- Saved reports match the answer presented in chat.
- Review effort and material error rates are recorded for repeated tasks.
- Recurring work has an owner and a useful destination.
- The chosen workflow fits the purchased features and access policy.
Keep the task set after the purchase. Rerun it when event definitions, product surfaces or AI behaviour change. A comparison becomes more valuable when it also gives your team a practical regression check for the decisions it makes every week.
Questions people ask
Is Mixpanel Spark still the right product to evaluate?
Mixpanel's current documentation identifies Mixpanel Agent as Spark's evolution. Evaluate the interface and enabled features in your account rather than relying on an older Spark demonstration.
Does Verified Mode guarantee only approved data is used?
Mixpanel's current documentation says it prioritizes verified data and flags unverified results without excluding requested data. Use access controls for access restrictions and inspect the evidence behind consequential answers.
Can either AI fix an inconsistent event taxonomy?
An assistant can help identify ambiguous names and propose a mapping, but someone must establish which events represent the business actions. Validate instrumentation and maintain the approved definitions before treating generated analysis as dependable.
Should I compare the same prompt in both products?
Use the same substantive question, definitions and equivalent population. Adapt only the interface mechanics, and record any extra context or manual correction needed so the comparison remains interpretable.
What is the most useful success metric for the pilot?
Measure the active time required to reach a correct, reviewable decision, alongside material errors. Prompt counts, fast responses and attractive charts do not establish that the team is making better product decisions.
Sources
- Mixpanel Agent documentation, accessed 1 October 2026.
- Mixpanel Business Context, accessed 1 October 2026.
- Amplitude AI overview, accessed 1 October 2026.
- Amplitude AI settings and controls, accessed 1 October 2026.
- Amplitude custom agents, accessed 1 October 2026.
- Mixpanel AI trust, safety and compliance, accessed 1 October 2026.
- Amplitude AI privacy and security, accessed 1 October 2026.
Written by
Jafrin Akter AloData Engineer and Co-founder, martechdevs
Jafrin Akter Alo is a data engineer and co-founder of martechdevs, where the team has delivered 74+ martech, data and growth stack implementations.